Hi Traders,
What i have see?
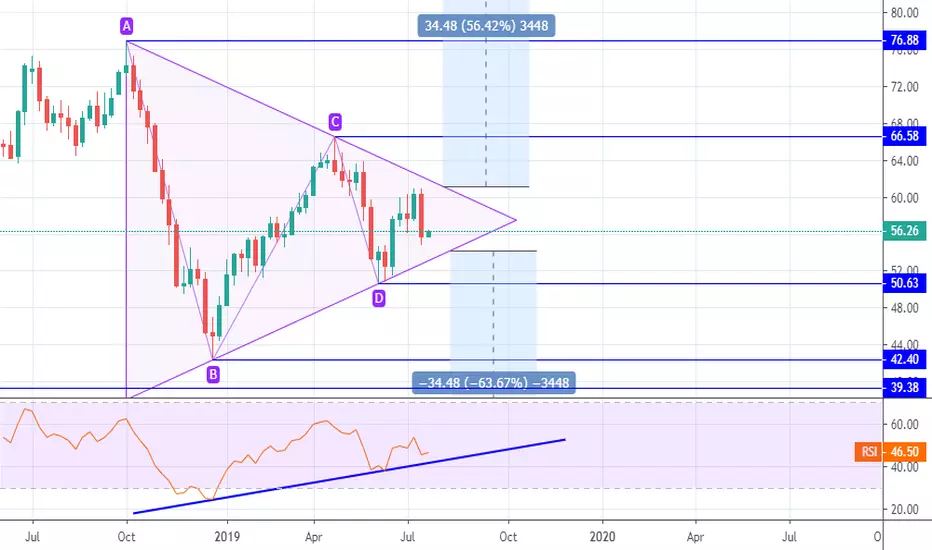
USOIL formed Symmetric Triangle Pattern as per chart.
RSI(7) Indicates me possible upside broken. It take support at trend-line.
Once triangle broken price will go upto 95$
Long Target:-
What i have see?
USOIL formed Symmetric Triangle Pattern as per chart.
RSI(7) Indicates me possible upside broken. It take support at trend-line.
Once triangle broken price will go upto 95$
Long Target:-
- $63.58
- $76.88
- $95.79
Possible Reason for Upside Breakout- OPEC+ Production Cut
- Middle East Tension
I need your support for my effort. .
To Support - Like, Follow and CommentThanks for your Support :)
You can share your Ideas, feedback and suggestion in Comments Box.
Your Comments are Welcome :) - OPEC+ Production Cut
Disclaimer
The information and publications are not meant to be, and do not constitute, financial, investment, trading, or other types of advice or recommendations supplied or endorsed by TradingView. Read more in the Terms of Use.
Disclaimer
The information and publications are not meant to be, and do not constitute, financial, investment, trading, or other types of advice or recommendations supplied or endorsed by TradingView. Read more in the Terms of Use.