Of course. Here is a detailed analysis of the provided financial chart for USOIL (WTI Crude Oil).
### Executive Summary
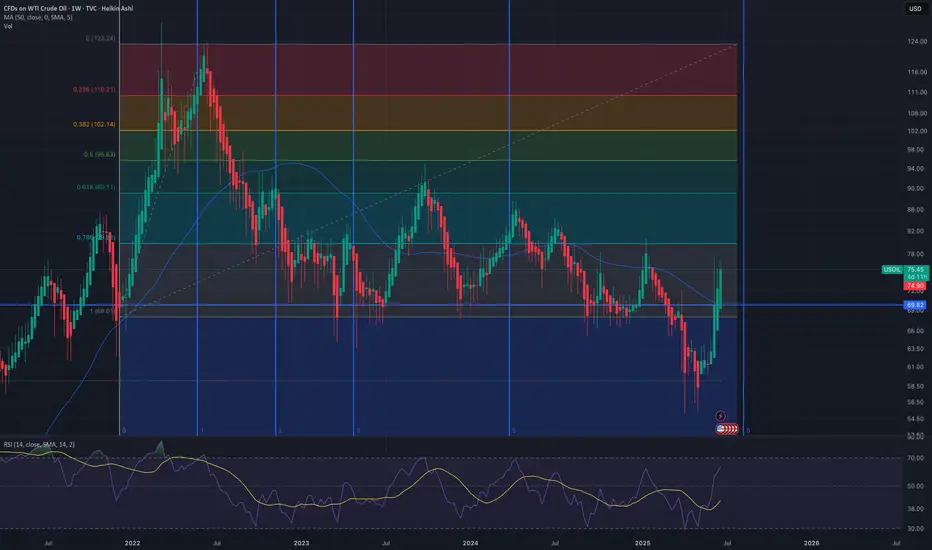
This is a **weekly (1W) Heikin Ashi chart** for CFDs on WTI Crude Oil (USOIL). The chart displays a long-term view, with a prominent downtrend from a peak in 2022. However, there has been a very strong bullish reversal in the most recent weeks. The analysis points to a critical juncture where the price is testing a key long-term resistance level. The bullish momentum is strong, but it faces significant hurdles ahead.
### Detailed Breakdown
#### 1. Asset and Chart Type
* **Asset:** USOIL (WTI Crude Oil), traded as a Contract for Difference (CFD).
* **Timeframe:** 1W (Weekly). Each candle represents one week of price action. This chart is used for analyzing long-term trends.
* **Chart Type:** Heikin Ashi. Unlike standard candlesticks, Heikin Ashi candles are calculated using averages, which smooths out price action and makes trends easier to identify. Long green candles with no lower wicks indicate strong buying pressure, while long red candles with no upper wicks indicate strong selling pressure.
#### 2. Current Price Action
* The last visible candle is a **strong green Heikin Ashi candle**, indicating significant bullish momentum during that week.
* The data for this candle shows: **Open 69.22, High 77.10, Low 69.22, Close 75.41**. This represents a gain of **+4.19%** for the week.
* The price has bounced sharply from a recent low and is now in its third consecutive week of gains.
#### 3. Key Technical Indicators
**a) Fibonacci Retracement:**
* This tool is drawn from a significant low (marked as 1 at **$68.01**) to a major high (marked as 0 at **$123.24**). It's used to identify potential support and resistance levels.
* The price has been trading between the 0.618 and 1 levels for a prolonged period.
* The recent low was found just below the `1` level ($68.01), indicating a potential double-bottom or failure to break lower.
* The price has since reclaimed the `0.786` level ($79.83) and is currently trading around the **$75.41** mark. The next major resistance levels based on this tool are:
* **0.786:** $79.83
* **0.618:** $89.11
* **0.5:** $95.63
**b) Moving Average (MA):**
* A **50-period Moving Average (MA 50)** is present on the chart (the blue line), with a current value of **69.89**.
* On a weekly chart, the 50-week MA is a critical long-term trend indicator.
* The price has been consistently below the 50-week MA since late 2022, confirming the long-term bearish trend.
* **Crucially, the current price is attempting to break above this moving average.** A sustained close above the 50-week MA would be a strong bullish signal. Conversely, if this level acts as resistance and the price is rejected, it could signal a continuation of the downtrend.
**c) Relative Strength Index (RSI):**
* The RSI (14) is shown at the bottom. The purple line (RSI) is currently at **63.33** and its moving average (yellow line) is at **41.95**.
* The RSI is pointing upwards and has decisively crossed above its moving average, indicating **building bullish momentum**.
* It is not yet in the "overbought" territory (typically above 70), which suggests there could be more room for the price to move higher before becoming extended.
**d) Fibonacci Time Zones:**
* The vertical blue lines numbered 0, 1, 2, 3, 5, 8 are Fibonacci Time Zones. They are used to forecast potential turning points in the market based on time intervals.
* The recent major low occurred very close to the "8" time zone marker, which may have contributed to the timing of this reversal.
### Synthesis and Potential Scenarios
* **Bullish Scenario:** The combination of strong green Heikin Ashi candles, a rising RSI, and a bounce from a key long-term low points to strong short-term bullish momentum. If the price can decisively break and hold above the **50-week MA (around $70)** and the **Fibonacci 0.786 level ($79.83)**, the next major target would be the **0.618 level at $89.11**.
* **Bearish Scenario:** The long-term trend remains bearish as long as the price is below the 50-week MA. This level, combined with the psychological resistance at $80, could prove to be a formidable barrier. If the price fails to break through, it could be rejected back down to test recent lows around the **$68.00** area.
In conclusion, the chart shows a classic battle between short-term bullish momentum and a long-term bearish trend. The price's interaction with the **50-week moving average** in the coming weeks will be critical in determining the next major directional move for WTI Crude Oil.
### Executive Summary
This is a **weekly (1W) Heikin Ashi chart** for CFDs on WTI Crude Oil (USOIL). The chart displays a long-term view, with a prominent downtrend from a peak in 2022. However, there has been a very strong bullish reversal in the most recent weeks. The analysis points to a critical juncture where the price is testing a key long-term resistance level. The bullish momentum is strong, but it faces significant hurdles ahead.
### Detailed Breakdown
#### 1. Asset and Chart Type
* **Asset:** USOIL (WTI Crude Oil), traded as a Contract for Difference (CFD).
* **Timeframe:** 1W (Weekly). Each candle represents one week of price action. This chart is used for analyzing long-term trends.
* **Chart Type:** Heikin Ashi. Unlike standard candlesticks, Heikin Ashi candles are calculated using averages, which smooths out price action and makes trends easier to identify. Long green candles with no lower wicks indicate strong buying pressure, while long red candles with no upper wicks indicate strong selling pressure.
#### 2. Current Price Action
* The last visible candle is a **strong green Heikin Ashi candle**, indicating significant bullish momentum during that week.
* The data for this candle shows: **Open 69.22, High 77.10, Low 69.22, Close 75.41**. This represents a gain of **+4.19%** for the week.
* The price has bounced sharply from a recent low and is now in its third consecutive week of gains.
#### 3. Key Technical Indicators
**a) Fibonacci Retracement:**
* This tool is drawn from a significant low (marked as 1 at **$68.01**) to a major high (marked as 0 at **$123.24**). It's used to identify potential support and resistance levels.
* The price has been trading between the 0.618 and 1 levels for a prolonged period.
* The recent low was found just below the `1` level ($68.01), indicating a potential double-bottom or failure to break lower.
* The price has since reclaimed the `0.786` level ($79.83) and is currently trading around the **$75.41** mark. The next major resistance levels based on this tool are:
* **0.786:** $79.83
* **0.618:** $89.11
* **0.5:** $95.63
**b) Moving Average (MA):**
* A **50-period Moving Average (MA 50)** is present on the chart (the blue line), with a current value of **69.89**.
* On a weekly chart, the 50-week MA is a critical long-term trend indicator.
* The price has been consistently below the 50-week MA since late 2022, confirming the long-term bearish trend.
* **Crucially, the current price is attempting to break above this moving average.** A sustained close above the 50-week MA would be a strong bullish signal. Conversely, if this level acts as resistance and the price is rejected, it could signal a continuation of the downtrend.
**c) Relative Strength Index (RSI):**
* The RSI (14) is shown at the bottom. The purple line (RSI) is currently at **63.33** and its moving average (yellow line) is at **41.95**.
* The RSI is pointing upwards and has decisively crossed above its moving average, indicating **building bullish momentum**.
* It is not yet in the "overbought" territory (typically above 70), which suggests there could be more room for the price to move higher before becoming extended.
**d) Fibonacci Time Zones:**
* The vertical blue lines numbered 0, 1, 2, 3, 5, 8 are Fibonacci Time Zones. They are used to forecast potential turning points in the market based on time intervals.
* The recent major low occurred very close to the "8" time zone marker, which may have contributed to the timing of this reversal.
### Synthesis and Potential Scenarios
* **Bullish Scenario:** The combination of strong green Heikin Ashi candles, a rising RSI, and a bounce from a key long-term low points to strong short-term bullish momentum. If the price can decisively break and hold above the **50-week MA (around $70)** and the **Fibonacci 0.786 level ($79.83)**, the next major target would be the **0.618 level at $89.11**.
* **Bearish Scenario:** The long-term trend remains bearish as long as the price is below the 50-week MA. This level, combined with the psychological resistance at $80, could prove to be a formidable barrier. If the price fails to break through, it could be rejected back down to test recent lows around the **$68.00** area.
In conclusion, the chart shows a classic battle between short-term bullish momentum and a long-term bearish trend. The price's interaction with the **50-week moving average** in the coming weeks will be critical in determining the next major directional move for WTI Crude Oil.
Disclaimer
The information and publications are not meant to be, and do not constitute, financial, investment, trading, or other types of advice or recommendations supplied or endorsed by TradingView. Read more in the Terms of Use.
Disclaimer
The information and publications are not meant to be, and do not constitute, financial, investment, trading, or other types of advice or recommendations supplied or endorsed by TradingView. Read more in the Terms of Use.