Carrying on from this idea > 
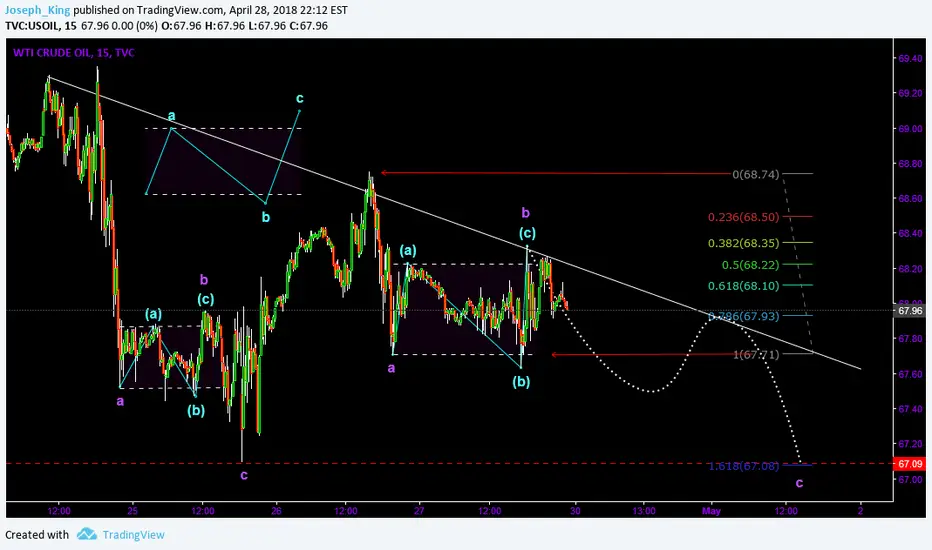
Looks like we have seen the second running flat ABC correction that formed a larger B wave. According to reference material a running flat correction is when price is range bound, wave B terminate below the start point of wave A and wave C terminates above the end point of wave A. Looks like that same pattern has formed in crude.
If that is a flat ABC correction then it should form a higher degree B wave, meaning C wave has started.
Interestingly 1.618 of A wave points to 6710 are for the triple bottom and completion of larger descending triangle.
Disclaimer
The information and publications are not meant to be, and do not constitute, financial, investment, trading, or other types of advice or recommendations supplied or endorsed by TradingView. Read more in the Terms of Use.
Disclaimer
The information and publications are not meant to be, and do not constitute, financial, investment, trading, or other types of advice or recommendations supplied or endorsed by TradingView. Read more in the Terms of Use.