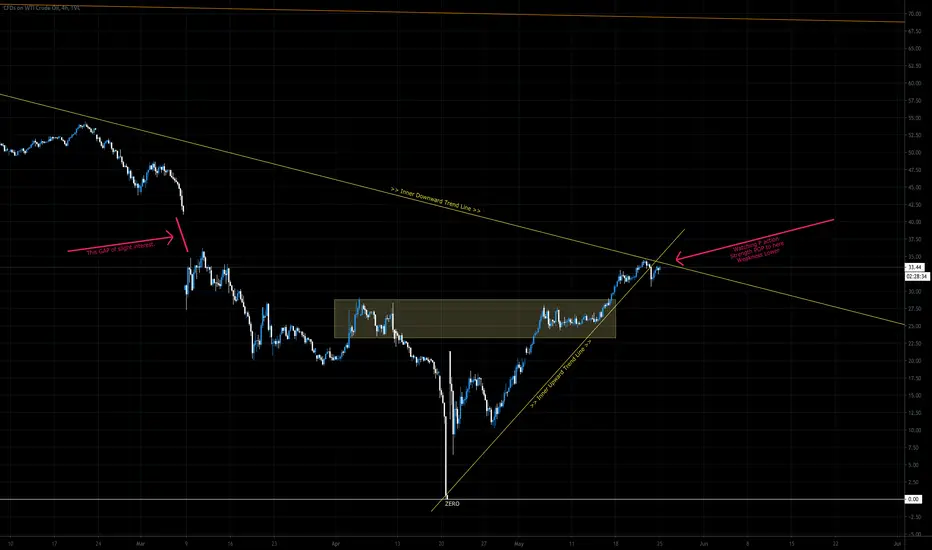
Currently todays market open has shown P action below the inner downward trend line and inner upward trend line. Currently watching P action to see if Bulls Vs Bears has the strength.
Daily View:

Published chart 4hour view above ^
Also see Gap for slight interest area if price is more bullish this week.
📈Support & Resistance📉*
Support Levels
1st Support Zone: 28.82
2nd Support Zone: 24.89
3rd Support Zone: 20.72
Resistance Levels:
1st Resistance Zone: 33.93
2nd Resistance Zone: 37.62
3rd Resistance Zone: 42.11

Price Level Consideration
ATH: 147.27
All Time High Half Way Point: 73.64
Prominent High: 65.53
Prominent Low: ZERO
🐃 Bulls Verse Bears 🐻
🐃 Bullish above: 77.04
🐻 Bearish below: BEARISH at the moment
Monthly & Weekly Opens
Monthly Open:18.86
Weekly Open: 33.56

Daily View:
Published chart 4hour view above ^
Also see Gap for slight interest area if price is more bullish this week.
📈Support & Resistance📉*
Support Levels
1st Support Zone: 28.82
2nd Support Zone: 24.89
3rd Support Zone: 20.72
Resistance Levels:
1st Resistance Zone: 33.93
2nd Resistance Zone: 37.62
3rd Resistance Zone: 42.11
Price Level Consideration
ATH: 147.27
All Time High Half Way Point: 73.64
Prominent High: 65.53
Prominent Low: ZERO
🐃 Bulls Verse Bears 🐻
🐃 Bullish above: 77.04
🐻 Bearish below: BEARISH at the moment
Monthly & Weekly Opens
Monthly Open:18.86
Weekly Open: 33.56
Related publications
Disclaimer
The information and publications are not meant to be, and do not constitute, financial, investment, trading, or other types of advice or recommendations supplied or endorsed by TradingView. Read more in the Terms of Use.
Related publications
Disclaimer
The information and publications are not meant to be, and do not constitute, financial, investment, trading, or other types of advice or recommendations supplied or endorsed by TradingView. Read more in the Terms of Use.