I have been watching the Commodity markets recently keenly to get direction or for market indications.  GLD, Copper and
  USOIL are the big 3 which determines the direction of commodity markets and hence the inflation. Inflation dictates direction of
  US10Y,
  DXY and hence the Equity markets. So, what are commodity markets telling us? With GLD and
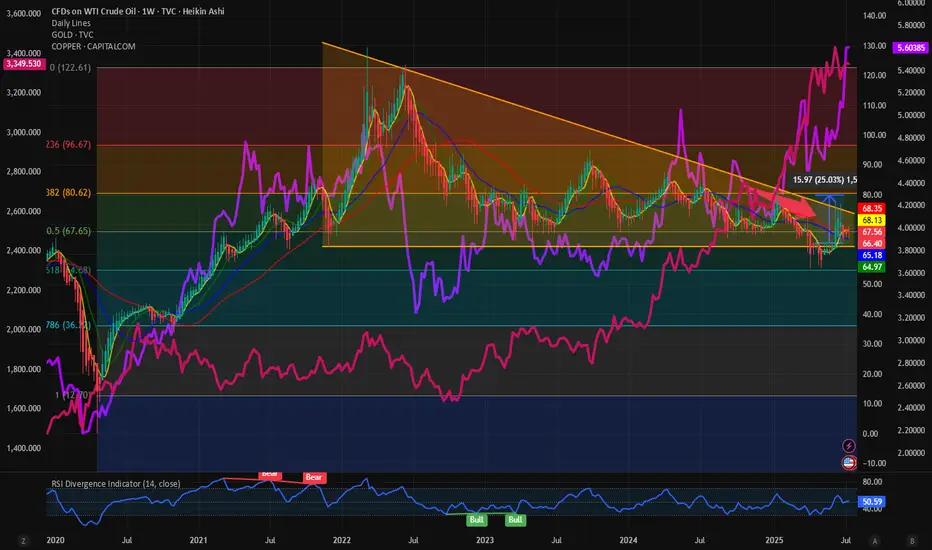
  XCUUSD at ATH what does this mean for USOIL: USOIL Is in a bearish pattern and no sign of concrete bullish reversal on the commodity. Recently it has shown some signs of strength but still below its 0.5 Fib retracement level which is at 68 and we have time and again said that 0.318 Fib level at 80 $ might prove to be an upper resistance which will be difficult to breakout.
In the recent months wheneverUSOIL tries to break out of the 60 RSI sellers came back and pushed the prices down. Currently with RSI at 50 we might have some room for upside. Oil bulls can have a 20% upside in the RSI taking it to 60 which has historically proved to be a resistance. And a 20% upside in price is also possible with price hitting our 0.318 resistance level of 80%. Above that there is limited upside for $USOIL. The downward slopping wedge shown below indicates a breakout might be imminent which might take USOIL to 80 $ which is our highest target in this range bound market.
In contrast the bull run in other important commodities likeGLD and COPPER might have some legs as they are showing strength by breaking above the previous ATH. It is always a good idea to buy strength and ATH.
Verdict:USOIL remains range bound with 55 $ on lower bound and 80 on the upper bound. Commodity bulls can look at GLD and XCUUSD for better returns.
In the recent months whenever
In contrast the bull run in other important commodities like
Verdict:
Related publications
Disclaimer
The information and publications are not meant to be, and do not constitute, financial, investment, trading, or other types of advice or recommendations supplied or endorsed by TradingView. Read more in the Terms of Use.
Related publications
Disclaimer
The information and publications are not meant to be, and do not constitute, financial, investment, trading, or other types of advice or recommendations supplied or endorsed by TradingView. Read more in the Terms of Use.