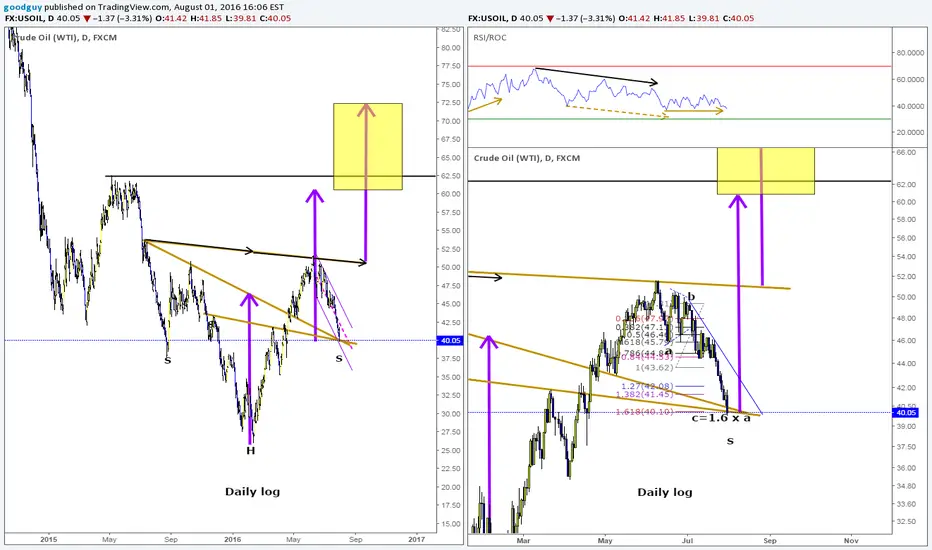
I did yesterdays post late last night when I was tired. In reviewing it this morning I realize I I did the triangle incorrectly. Above is the way I have been counting it on earlier posts the last couple of months and I believe is more correct. With today's drop c= 1.6 x a and the price level approximates the possible right shoulder. We will see what happens tomorrow. If we get a long bullish candle or a gap up with trend line break if will support than this analysis is correct.
Related publications
Disclaimer
The information and publications are not meant to be, and do not constitute, financial, investment, trading, or other types of advice or recommendations supplied or endorsed by TradingView. Read more in the Terms of Use.
Related publications
Disclaimer
The information and publications are not meant to be, and do not constitute, financial, investment, trading, or other types of advice or recommendations supplied or endorsed by TradingView. Read more in the Terms of Use.