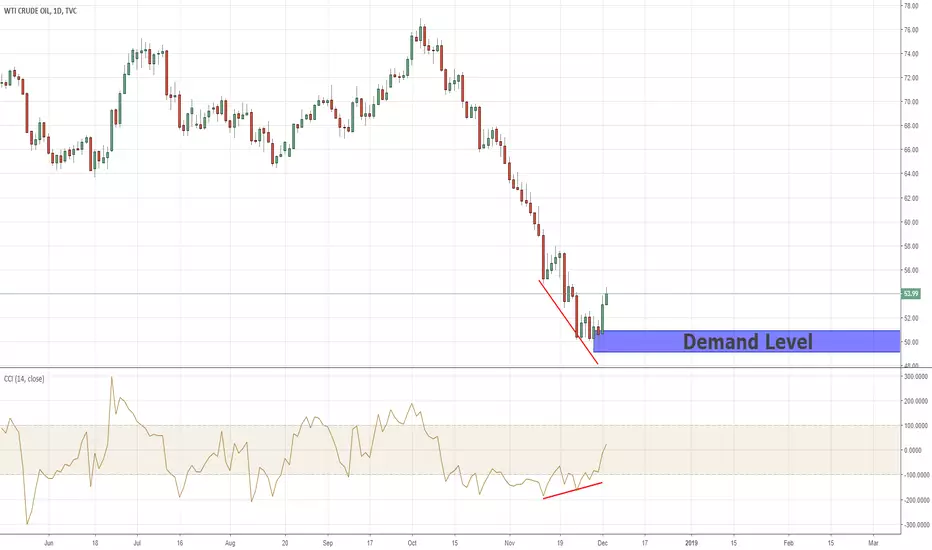
As we can see, the CCI indicator shows a clear divergence between the price lows and the indicator lows,
as the price create a lower low the CCI shows higher low, this kind of Divergence indicates this bearish momentum is losing power and there is a good chance the momentum will change to bullish, we can see the divergence by the trend line I marked on The CCI and the price. I always prefer to integrate between indicators and price action, especially with Supply & Demand, therefore, I'll wait for the price to return the demand below, if that happens, I'll buy at this demand and my target will be 64.00 zones.
as the price create a lower low the CCI shows higher low, this kind of Divergence indicates this bearish momentum is losing power and there is a good chance the momentum will change to bullish, we can see the divergence by the trend line I marked on The CCI and the price. I always prefer to integrate between indicators and price action, especially with Supply & Demand, therefore, I'll wait for the price to return the demand below, if that happens, I'll buy at this demand and my target will be 64.00 zones.
The5ers Funding Forex Traders & Growth Program. Get Funded with up to $2.56M
We Trade Forex - Come Join Us!
the5ers.com
We Trade Forex - Come Join Us!
the5ers.com
Disclaimer
The information and publications are not meant to be, and do not constitute, financial, investment, trading, or other types of advice or recommendations supplied or endorsed by TradingView. Read more in the Terms of Use.