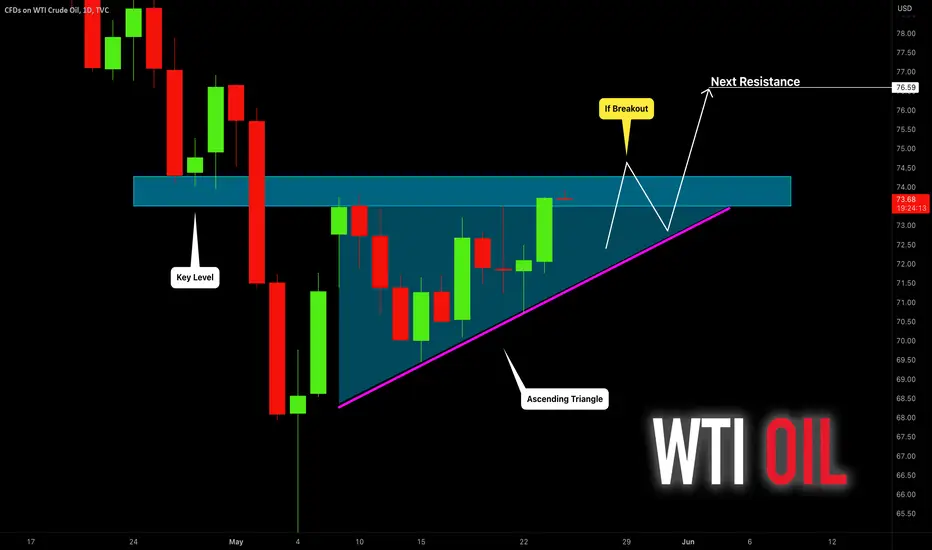
It looks like WTI Crude Oil is forming an ascending triangle formation on a daily time frame
that signifies a bullish accumulation.
To confirm a bullish continuation, monitor the neckline of the pattern.
If the price breaks and closes above 74.3 that will confirm the strength of bulls.
A bullish continuation will be expected to 76.6 level then.
❤️Please, support my work with like, thank you!❤️
✅Join My Telegram Channel: t.me/VasilyTrading
❗️YouTube Channel youtube.com/c/VasilyTrader
✅ Facebook: facebook.com/VasilyTrading/
⭐ My Forex & Gold Broker: bit.ly/vasilyforexbroker ⭐
❗️YouTube Channel youtube.com/c/VasilyTrader
✅ Facebook: facebook.com/VasilyTrading/
⭐ My Forex & Gold Broker: bit.ly/vasilyforexbroker ⭐
Related publications
Disclaimer
The information and publications are not meant to be, and do not constitute, financial, investment, trading, or other types of advice or recommendations supplied or endorsed by TradingView. Read more in the Terms of Use.