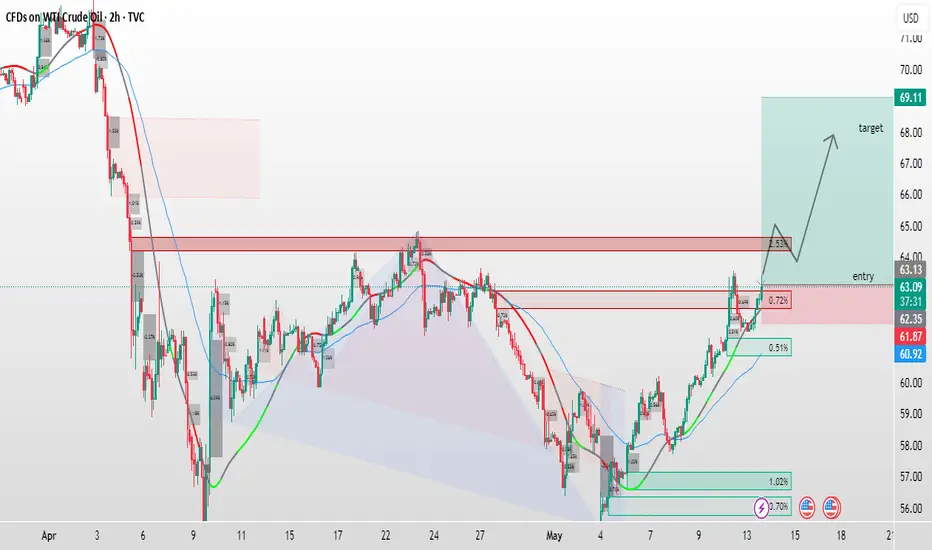
Instrument: CFDs on WTI Crude Oil
Timeframe: 2-hour (2h)
Current Price: Around 69.35 USD
Indicators:
Moving Averages: Two are visible (likely 50 and 200-period EMAs)
Fibonacci Levels: Retracement levels marked
Key Zones:
Resistance Zone (Red box): Around 63–65 USD
Support Zone: Around 61–62 USD
Price Action:
There was a significant downtrend, followed by a double bottom/reversal.
Price has broken above previous resistance and is now retesting the breakout zone.
Trade Setup:
Entry Zone: Around 63.10 USD
Target Zone: Around 69.11 USD
Stop Loss: Near 61.87 USD (based on the support zone/Fibonacci 0.5 level)
The green box suggests a bullish projection, expecting price to rise after a pullback and retest.
Interpretation:
This chart implies a bullish setup, where the trader expects:
A minor retracement to the highlighted red resistance-turned-support zone.
A continuation toward the target at 69.11 USD.
The risk-reward ratio is favorable if the entry occurs near the zone outlined.
Free Accurate GOLD Signals Quality Education 🎓Quality Analysis 🔥🔥High Impact News Livetrades Accuracy 💯💯 All FREE!
Disclaimer
The information and publications are not meant to be, and do not constitute, financial, investment, trading, or other types of advice or recommendations supplied or endorsed by TradingView. Read more in the Terms of Use.