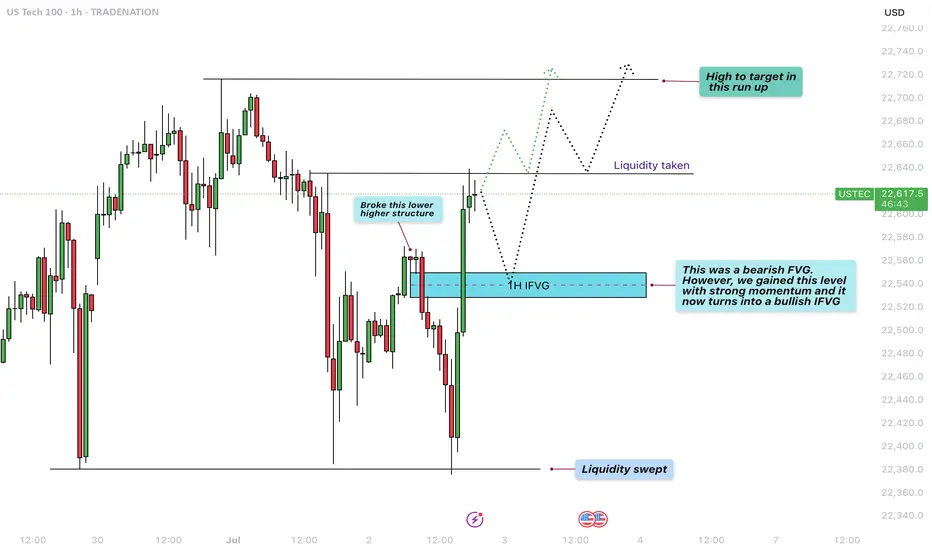
The chart presented shows a 1-hour analysis of the US100 (Nasdaq 100), illustrating a clean and structured price action narrative. Initially, we observe that the market swept liquidity at the lows, indicated by a sharp wick that pierced beneath the previous support levels. This type of liquidity sweep is common when smart money looks to grab stop-loss orders before reversing the trend.
Liquidity sweep to the downside
Following this liquidity sweep, price action aggressively moved upwards, breaking a lower high structure that had previously marked the bearish control of the market. This break of structure is a key bullish signal, suggesting a shift in momentum from bearish to bullish, and often signifies the beginning of a new upward leg.
1H FVG
An important element on this chart is the 1-hour Fair Value Gap (FVG), initially acting as a bearish imbalance. However, due to the strong bullish momentum, price not only reclaimed this level but did so decisively. As a result, this bearish FVG is now considered a bullish FVG, indicating that it may serve as a support zone on any short-term pullback.
Liquidity taken from the upside
After reclaiming the FVG and breaking structure, price surged further, taking out upside liquidity just above recent highs. This action typically leads to a short-term pullback, as profit-taking and new supply enter the market. The chart suggests that any retracement may find support at the 1H FVG, providing a potential entry point for bullish continuation.
Conclusion
In conclusion, the US100 demonstrated a textbook liquidity grab at the lows, followed by a break in bearish structure, a shift in momentum, and an inversion of a key FVG zone from bearish to bullish. The short-term upside liquidity has been cleared, and the next logical target is the high marked on the chart. Should the price respect the newly formed bullish FVG on any pullback, we can expect continuation toward that upper high, completing the bullish run.
Disclosure: I am part of Trade Nation's Influencer program and receive a monthly fee for using their TradingView charts in my analysis.
Thanks for your support.
- Make sure to follow me so you don't miss out on the next analysis!
- Drop a like and leave a comment!
Trade active
Trade closed: target reached
Already played out. New ath!🔸 Free trading Discord
discord.gg/fVfJHHQSMG
🔹 Free trading signals
t.me/CandleCollective
discord.gg/fVfJHHQSMG
🔹 Free trading signals
t.me/CandleCollective
Related publications
Disclaimer
The information and publications are not meant to be, and do not constitute, financial, investment, trading, or other types of advice or recommendations supplied or endorsed by TradingView. Read more in the Terms of Use.
🔸 Free trading Discord
discord.gg/fVfJHHQSMG
🔹 Free trading signals
t.me/CandleCollective
discord.gg/fVfJHHQSMG
🔹 Free trading signals
t.me/CandleCollective
Related publications
Disclaimer
The information and publications are not meant to be, and do not constitute, financial, investment, trading, or other types of advice or recommendations supplied or endorsed by TradingView. Read more in the Terms of Use.