Over the past week, the US Tech 100 (US100) experienced a sharp decline, dropping into a significant support zone. During this bearish move, several fair value gaps (FVGs) formed on both the 4-hour and 1-hour timeframes, which remain unfilled. Currently, price action is retracing upward, aiming to fill these imbalances. The structure of the market suggests that both bullish and bearish scenarios are in play, depending on how price reacts to key levels marked by these FVGs and Fibonacci retracement zones.
Bearish Resistance
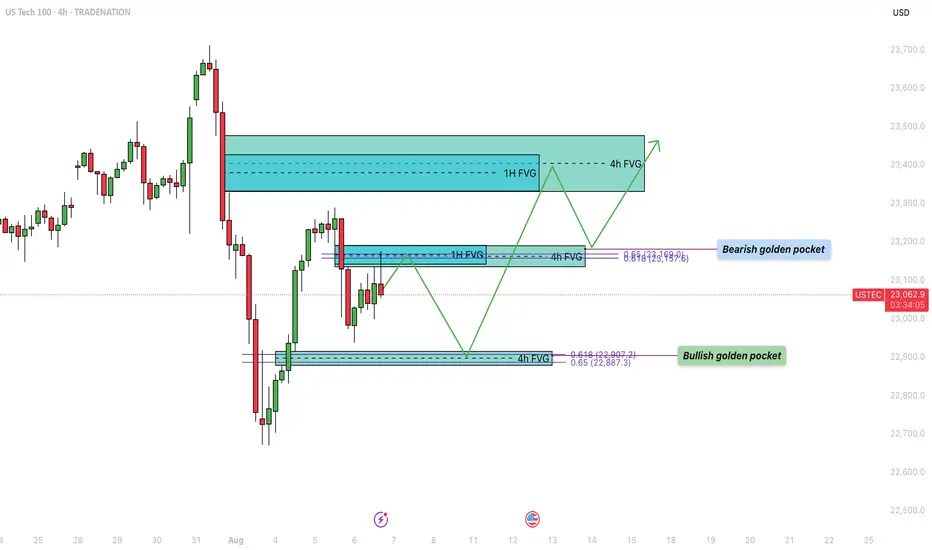
The first major area of resistance is located around the $23,160 level, which has just been tapped. This zone presents a strong potential turning point due to the confluence of a 1-hour and a 4-hour fair value gap, which perfectly align with the 0.618–0.65 Fibonacci retracement level, also known as the golden pocket. This cluster of technical signals increases the probability that this level will act as a strong supply zone, potentially initiating a rejection back toward the lower support area.
Bullish Support
On the downside, a key level to watch is around $22,900. This zone marks a 4-hour FVG that was formed during the recent upward move. Importantly, this area also coincides with the golden pocket from that very same leg up, offering a compelling confluence for bullish support. If price revisits this level, it may act as a strong demand zone, providing a springboard for the next leg higher, particularly if buyers step in aggressively to defend it.
Bullish Trajectory
If support at $22,900 holds, the bullish trajectory suggests a possible continuation toward the $23,400 region. This upper target contains a large overlapping 1-hour and 4-hour FVG that remains unfilled. Historically, price tends to revisit and fill such imbalances before choosing a definitive direction. A bounce from the lower support zone and a successful break of the $23,160 resistance could pave the way for a clean move toward this higher target, completing the FVG fill sequence.
Final Thoughts
The US100 is currently navigating a key technical crossroads. With multiple unfilled fair value gaps and well-aligned Fibonacci levels on both the upside and downside, the next few sessions will be critical in determining short-term direction. If the $23,160 resistance continues to hold, a pullback to $22,900 could offer a high-probability long setup, while a clean break above this resistance opens the door to filling the higher FVGs.
-------------------------
Disclosure: I am part of Trade Nation's Influencer program and receive a monthly fee for using their TradingView charts in my analysis.
Thanks for your support. If you enjoyed this analysis, make sure to follow me so you don't miss the next one. And if you found it helpful, feel free to drop a like 👍 and leave a comment 💬, I’d love to hear your thoughts!
Bearish Resistance
The first major area of resistance is located around the $23,160 level, which has just been tapped. This zone presents a strong potential turning point due to the confluence of a 1-hour and a 4-hour fair value gap, which perfectly align with the 0.618–0.65 Fibonacci retracement level, also known as the golden pocket. This cluster of technical signals increases the probability that this level will act as a strong supply zone, potentially initiating a rejection back toward the lower support area.
Bullish Support
On the downside, a key level to watch is around $22,900. This zone marks a 4-hour FVG that was formed during the recent upward move. Importantly, this area also coincides with the golden pocket from that very same leg up, offering a compelling confluence for bullish support. If price revisits this level, it may act as a strong demand zone, providing a springboard for the next leg higher, particularly if buyers step in aggressively to defend it.
Bullish Trajectory
If support at $22,900 holds, the bullish trajectory suggests a possible continuation toward the $23,400 region. This upper target contains a large overlapping 1-hour and 4-hour FVG that remains unfilled. Historically, price tends to revisit and fill such imbalances before choosing a definitive direction. A bounce from the lower support zone and a successful break of the $23,160 resistance could pave the way for a clean move toward this higher target, completing the FVG fill sequence.
Final Thoughts
The US100 is currently navigating a key technical crossroads. With multiple unfilled fair value gaps and well-aligned Fibonacci levels on both the upside and downside, the next few sessions will be critical in determining short-term direction. If the $23,160 resistance continues to hold, a pullback to $22,900 could offer a high-probability long setup, while a clean break above this resistance opens the door to filling the higher FVGs.
-------------------------
Disclosure: I am part of Trade Nation's Influencer program and receive a monthly fee for using their TradingView charts in my analysis.
Thanks for your support. If you enjoyed this analysis, make sure to follow me so you don't miss the next one. And if you found it helpful, feel free to drop a like 👍 and leave a comment 💬, I’d love to hear your thoughts!
Trade active
Looks like we moving up like expected. Let see if we can go to the highest resistance!Trade closed: target reached
Target level has been reached🔸 Free trading Discord
discord.gg/fVfJHHQSMG
🔹 Free trading signals
t.me/CandleCollective
discord.gg/fVfJHHQSMG
🔹 Free trading signals
t.me/CandleCollective
Disclaimer
The information and publications are not meant to be, and do not constitute, financial, investment, trading, or other types of advice or recommendations supplied or endorsed by TradingView. Read more in the Terms of Use.
🔸 Free trading Discord
discord.gg/fVfJHHQSMG
🔹 Free trading signals
t.me/CandleCollective
discord.gg/fVfJHHQSMG
🔹 Free trading signals
t.me/CandleCollective
Disclaimer
The information and publications are not meant to be, and do not constitute, financial, investment, trading, or other types of advice or recommendations supplied or endorsed by TradingView. Read more in the Terms of Use.