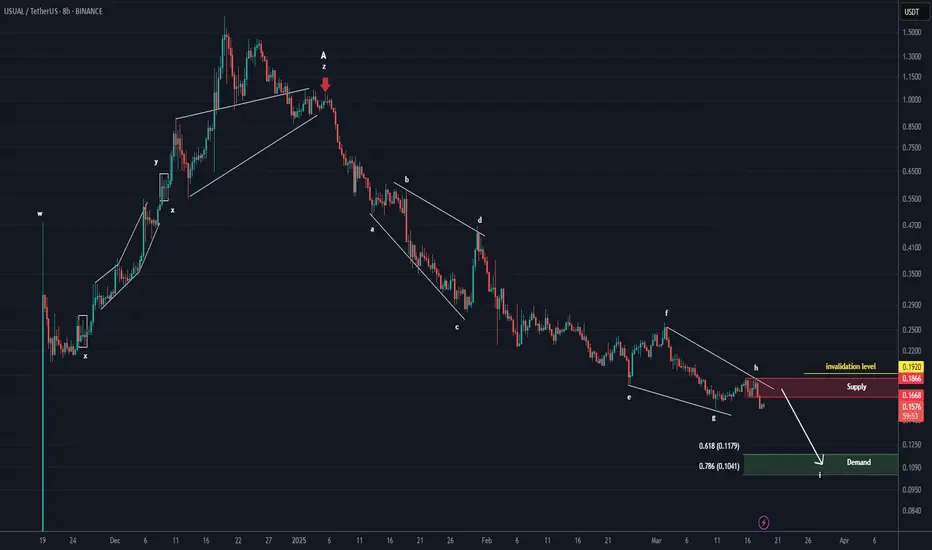
After wave A was completed, from the point where we placed the red arrow on the chart, it seems the price has entered wave B.
Wave B is a bearish symmetrical wave, and it currently appears that we are in the early stages of wave I, which is a bearish wave.
From the supply zone, we expect a rejection towards the Fibonacci levels of wave a to i, which corresponds to the green zone.
A daily candle closing above the invalidation level will invalidate this analysis.
For risk management, please don't forget stop loss and capital management
Comment if you have any questions
Thank You
Trade closed: target reached
Since the analysis, it has dropped more than 32% and reached the demand zone and you can see the reaction to the green zone after hitting the marked support area, it has pumped over 25% so far 🔆To succeed in trading, just enter our Telegram channel:
Free membership: t.me/Behdark_EN
🔷Our Telegram channel has daily spot and futures signals 👉 t.me/Behdark_EN
💎 Exclusive signals are only shared on our Telegram channel
Free membership: t.me/Behdark_EN
🔷Our Telegram channel has daily spot and futures signals 👉 t.me/Behdark_EN
💎 Exclusive signals are only shared on our Telegram channel
Disclaimer
The information and publications are not meant to be, and do not constitute, financial, investment, trading, or other types of advice or recommendations supplied or endorsed by TradingView. Read more in the Terms of Use.
🔆To succeed in trading, just enter our Telegram channel:
Free membership: t.me/Behdark_EN
🔷Our Telegram channel has daily spot and futures signals 👉 t.me/Behdark_EN
💎 Exclusive signals are only shared on our Telegram channel
Free membership: t.me/Behdark_EN
🔷Our Telegram channel has daily spot and futures signals 👉 t.me/Behdark_EN
💎 Exclusive signals are only shared on our Telegram channel
Disclaimer
The information and publications are not meant to be, and do not constitute, financial, investment, trading, or other types of advice or recommendations supplied or endorsed by TradingView. Read more in the Terms of Use.