Short
Utrust vs USD - bearish engulfing candle
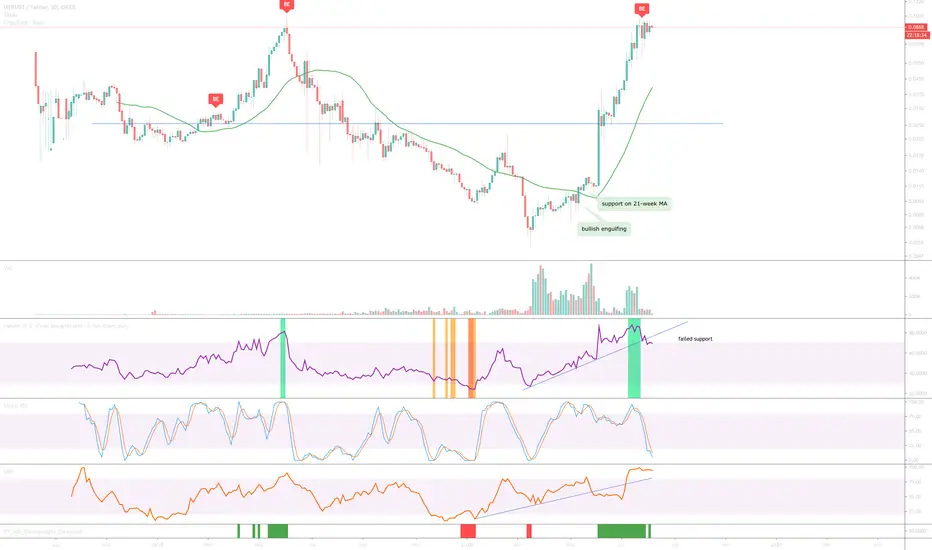
3-day chart above prints a bearish engulfing candle right at the same price point as previous high. This candle comes at a time when RSI supporting trend line breaks down.
Can price action go higher? Sure... that is possible, however, it is more probable to go lower; especially as Stochastic RSI crosses below 20.
1st target $0.40
2nd target $0.25
Can price action go higher? Sure... that is possible, however, it is more probable to go lower; especially as Stochastic RSI crosses below 20.
1st target $0.40
2nd target $0.25
BTC
bc1q2eckdzh0q8vsd7swcc8et6ze7s99khhxyl7zwy
Weblink: patreon.com/withoutworries
Allow 3-6 months on ideas. Not investment advice. DYOR
bc1q2eckdzh0q8vsd7swcc8et6ze7s99khhxyl7zwy
Weblink: patreon.com/withoutworries
Allow 3-6 months on ideas. Not investment advice. DYOR
Disclaimer
The information and publications are not meant to be, and do not constitute, financial, investment, trading, or other types of advice or recommendations supplied or endorsed by TradingView. Read more in the Terms of Use.