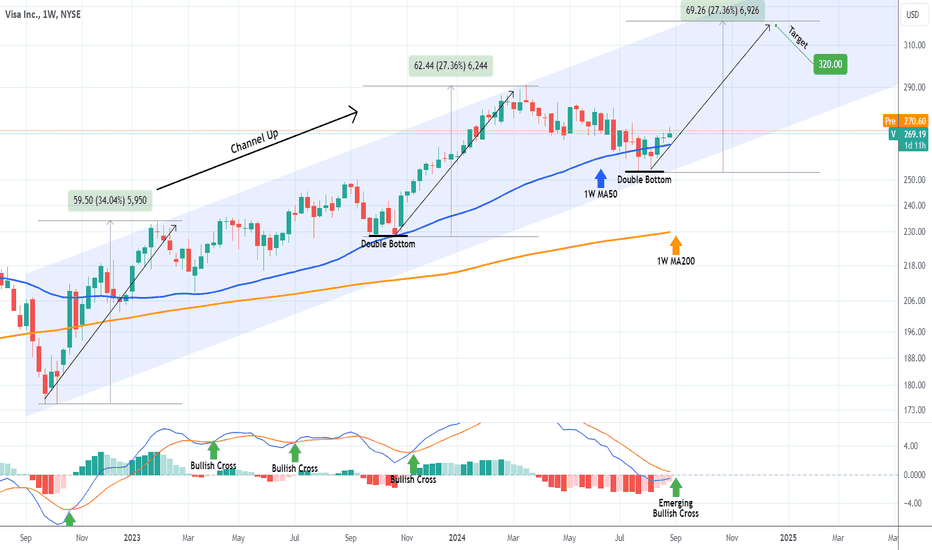
Visa Inc. (V) has been one of our most accurate recent stock predictions (August 29, see chart below), as it is about to complete the buy signal we gave on the Channel's bottom to a +27.36% rise and hit our $320.00 Target:
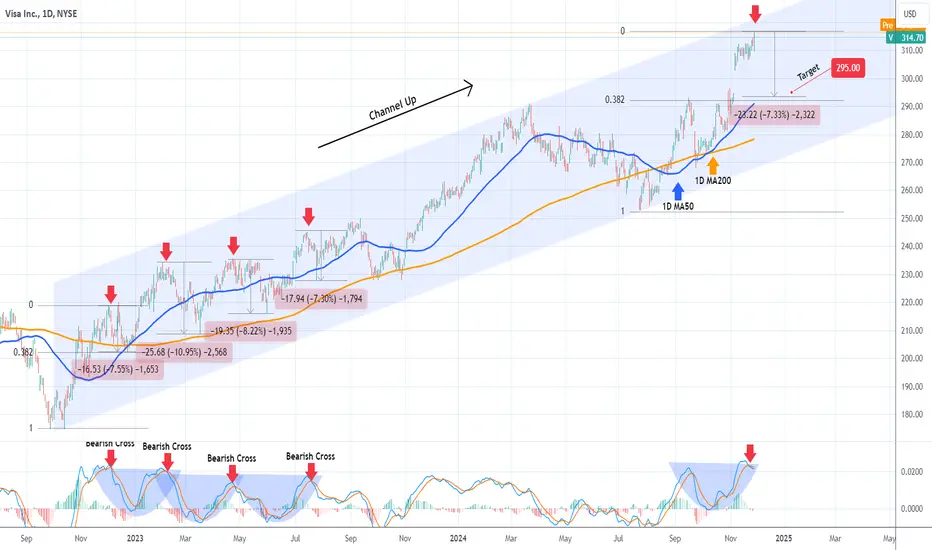
Needless to say, if you took that call, evaluate your options as the profit is already enormous. Moving forward, specifically zooming in on the 1D time-frame, we can see that Visa is flashing its first sell signal in a while.
The price isn't only almost at the top of the 2-year Channel Up but more importantly, the 1D MACD has completed a Cup sequence on a Bearish Cross, similar to all early corrections at the start of this Channel.
As you can see all MACD Bearish Crosses were followed by pull-backs of similar size with the minimum being -7.30%.
As a result, we can expect the stock to hit and even break below the 1D MA50 (blue trend-line) at $295.00 (-7.30% decline), which would be also near the 0.382 Fibonacci retracement level (similar to the December 22 2022 Low).
-------------------------------------------------------------------------------
** Please LIKE 👍, FOLLOW ✅, SHARE 🙌 and COMMENT ✍ if you enjoy this idea! Also share your ideas and charts in the comments section below! This is best way to keep it relevant, support us, keep the content here free and allow the idea to reach as many people as possible. **
-------------------------------------------------------------------------------
💸💸💸💸💸💸
👇 👇 👇 👇 👇 👇
👑Best Signals (Forex/Crypto+70% accuracy) & Account Management (+20% profit/month on 10k accounts)
💰Free Channel t.me/tradingshotglobal
🤵Contact info@tradingshot.com t.me/tradingshot
🔥New service: next X100 crypto GEMS!
💰Free Channel t.me/tradingshotglobal
🤵Contact info@tradingshot.com t.me/tradingshot
🔥New service: next X100 crypto GEMS!
Disclaimer
The information and publications are not meant to be, and do not constitute, financial, investment, trading, or other types of advice or recommendations supplied or endorsed by TradingView. Read more in the Terms of Use.