🔎 Chart Overview
VANRY/USDT is currently in a consolidation phase after a prolonged downtrend since early 2025. Key observations:
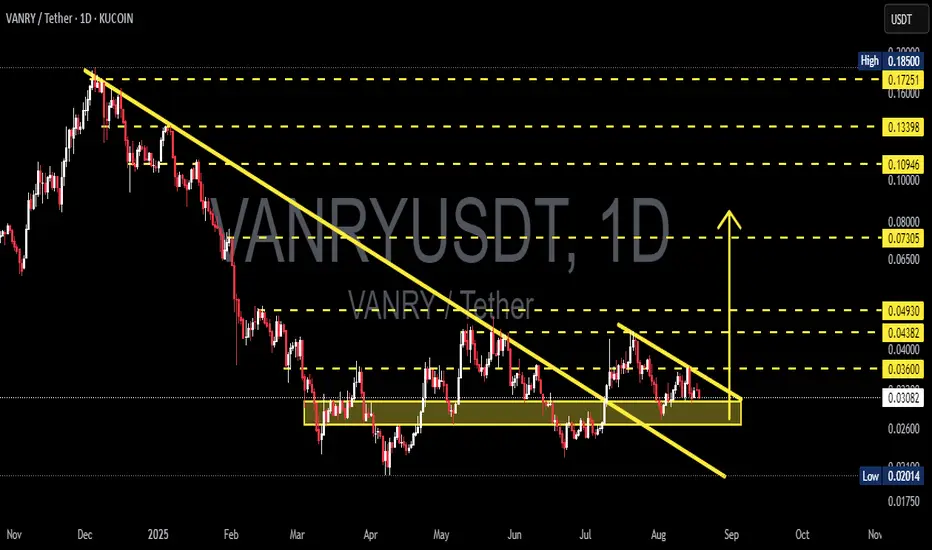
Price is stuck inside the demand zone 0.028 – 0.036 USDT (yellow box), which has acted as strong support for months.
A symmetrical triangle pattern is forming, indicating accumulation before a decisive move.
The descending trendline is still pressing the price down, but the apex is approaching → a major breakout or breakdown is imminent.
---
🚀 Bullish Scenario
Trigger:
✅ Daily close above 0.036 USDT with strong volume → breakout from the triangle and descending trendline.
Potential targets:
🎯 First target: 0.040 – 0.04382 USDT (minor resistance + triangle height projection).
🎯 Next target: 0.04930 USDT (key resistance).
🎯 With strong momentum: extension toward 0.07305 USDT, and potentially 0.109 – 0.133 USDT in the mid-term.
Additional bullish confirmation:
Successful retest of 0.036 as new support after breakout.
Increased buying volume confirming buyer dominance.
---
🐻 Bearish Scenario
Trigger:
❌ Daily close below 0.030 – 0.028 USDT → breakdown of the demand zone and triangle.
Potential targets:
🎯 First target: 0.026 USDT.
🎯 Next target: 0.024 USDT (triangle breakdown projection).
🎯 If selling pressure intensifies, price may revisit the historical low at 0.02014 USDT.
Additional bearish confirmation:
Breakdown supported by high volume.
Weak or no rebound after falling below 0.028.
---
📌 Conclusion
VANRY is at a critical stage. The symmetrical triangle within the demand zone signals price compression that will soon resolve.
A breakout above 0.036 USDT could spark a strong rally.
A breakdown below 0.028 USDT could open the way toward 0.02014 USDT.
👉 Key levels to watch: 0.036 (bullish breakout) and 0.028 (bearish breakdown) with daily close and volume confirmation.
#VANRY #VANRYUSDT #CryptoAnalysis #PriceAction #SymmetricalTriangle #Breakout #CryptoTrading #AltcoinAnalysis #TechnicalAnalysis
VANRY/USDT is currently in a consolidation phase after a prolonged downtrend since early 2025. Key observations:
Price is stuck inside the demand zone 0.028 – 0.036 USDT (yellow box), which has acted as strong support for months.
A symmetrical triangle pattern is forming, indicating accumulation before a decisive move.
The descending trendline is still pressing the price down, but the apex is approaching → a major breakout or breakdown is imminent.
---
🚀 Bullish Scenario
Trigger:
✅ Daily close above 0.036 USDT with strong volume → breakout from the triangle and descending trendline.
Potential targets:
🎯 First target: 0.040 – 0.04382 USDT (minor resistance + triangle height projection).
🎯 Next target: 0.04930 USDT (key resistance).
🎯 With strong momentum: extension toward 0.07305 USDT, and potentially 0.109 – 0.133 USDT in the mid-term.
Additional bullish confirmation:
Successful retest of 0.036 as new support after breakout.
Increased buying volume confirming buyer dominance.
---
🐻 Bearish Scenario
Trigger:
❌ Daily close below 0.030 – 0.028 USDT → breakdown of the demand zone and triangle.
Potential targets:
🎯 First target: 0.026 USDT.
🎯 Next target: 0.024 USDT (triangle breakdown projection).
🎯 If selling pressure intensifies, price may revisit the historical low at 0.02014 USDT.
Additional bearish confirmation:
Breakdown supported by high volume.
Weak or no rebound after falling below 0.028.
---
📌 Conclusion
VANRY is at a critical stage. The symmetrical triangle within the demand zone signals price compression that will soon resolve.
A breakout above 0.036 USDT could spark a strong rally.
A breakdown below 0.028 USDT could open the way toward 0.02014 USDT.
👉 Key levels to watch: 0.036 (bullish breakout) and 0.028 (bearish breakdown) with daily close and volume confirmation.
#VANRY #VANRYUSDT #CryptoAnalysis #PriceAction #SymmetricalTriangle #Breakout #CryptoTrading #AltcoinAnalysis #TechnicalAnalysis
✅ Get Free Signals! Join Our Telegram Channel Here: t.me/TheCryptoNuclear
✅ Twitter: twitter.com/crypto_nuclear
✅ Join Bybit : partner.bybit.com/b/nuclearvip
✅ Benefits : Lifetime Trading Fee Discount -50%
✅ Twitter: twitter.com/crypto_nuclear
✅ Join Bybit : partner.bybit.com/b/nuclearvip
✅ Benefits : Lifetime Trading Fee Discount -50%
Disclaimer
The information and publications are not meant to be, and do not constitute, financial, investment, trading, or other types of advice or recommendations supplied or endorsed by TradingView. Read more in the Terms of Use.