Long
VetBtc / Daily / Technical Chart
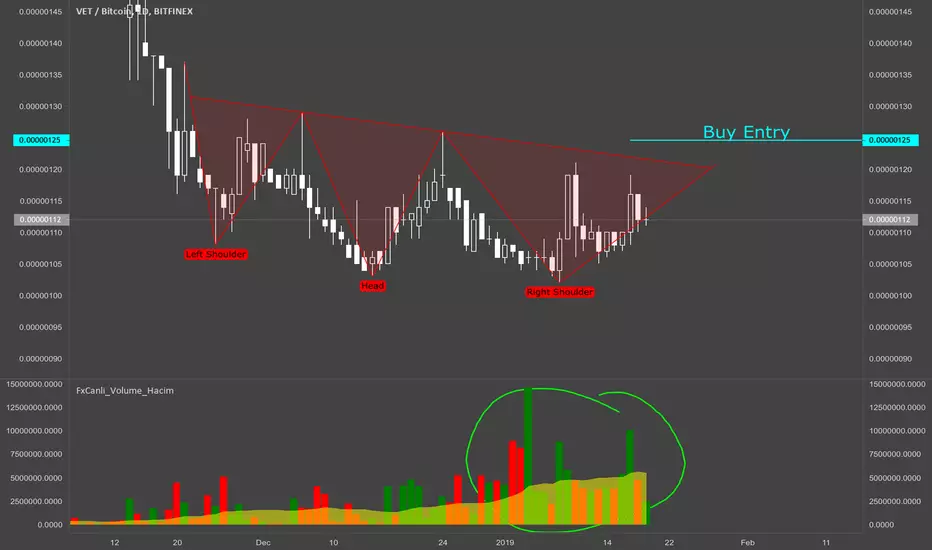
VetBtc is falling for several months
As you see on the chart, there is Inverse head and shoulders
We have to wait for breakout the neckline
I also see the difference at FxCanli_Volume indicator
Wish you many profit
As you see on the chart, there is Inverse head and shoulders
We have to wait for breakout the neckline
I also see the difference at FxCanli_Volume indicator
Wish you many profit
Eğitim & İndikatör & Sinyal
Course & Indicators & Signals
taplink.cc/FxCanli
YouTube
bit.ly/FxCanli-YouTube
Telegram
t.me/FxCanli
t.me/CryptoCanli
t.me/ForexCanli
t.me/WhalesRadar
Course & Indicators & Signals
taplink.cc/FxCanli
YouTube
bit.ly/FxCanli-YouTube
Telegram
t.me/FxCanli
t.me/CryptoCanli
t.me/ForexCanli
t.me/WhalesRadar
Related publications
Disclaimer
The information and publications are not meant to be, and do not constitute, financial, investment, trading, or other types of advice or recommendations supplied or endorsed by TradingView. Read more in the Terms of Use.