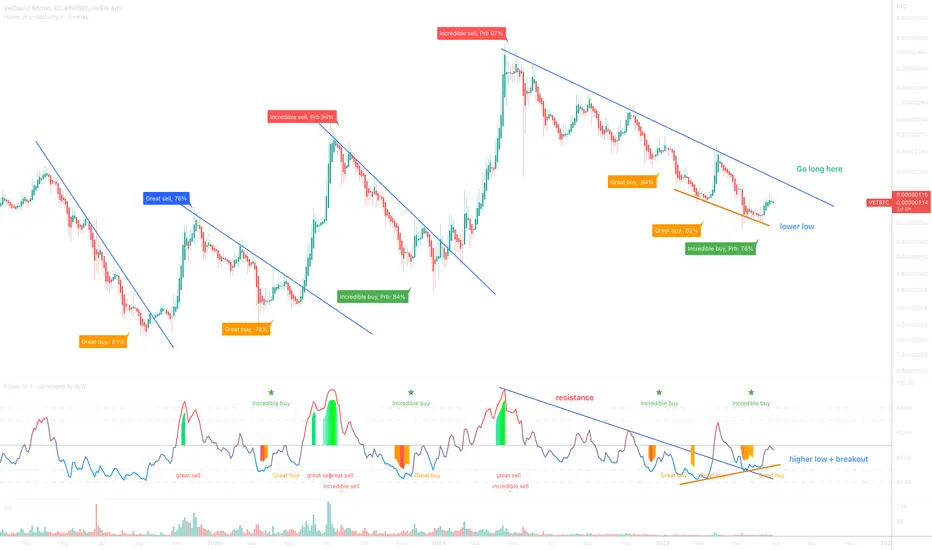
On the above 3-day chart price action has corrected 80% since May of 2021. A number of reasons now exist to be bullish.
1) A number of strong buy signals.
2) RSI resistance breakout.
3) Regular bullish divergence with multiple oscillators.
4) The monthly chart (below). Take time to study the channel price action is trading in and the candle printing. Should the following candle print ‘green’, then the rest is history.
Is it possible price action falls further? Sure.
Is it probable? No.
Action? When price action breaks resistance at ‘Go long here’, then ACT. If history is any teacher price action will top out between 60 and 90 days.
Ww
Type: trade
Risk: <=6% of portfolio
Timeframe: 3 - 6 month
Return: 2000%
Note
The monthly chartTrade active
Trade active
Price action breakout confirmedTrade active
Buy signals popping off on multiple time frames now.Trade active
A break of market structure - in a good way, resistance no longer.Trade active
Did you see?Note
Very little has changed since publishing this idea, price action is only down 10%. It really is only a matter of being patient.5-day chart
Trade active
The next move should please.BTC
bc1q2eckdzh0q8vsd7swcc8et6ze7s99khhxyl7zwy
Weblink: patreon.com/withoutworries
Allow 3-6 months on ideas. Not investment advice. DYOR
bc1q2eckdzh0q8vsd7swcc8et6ze7s99khhxyl7zwy
Weblink: patreon.com/withoutworries
Allow 3-6 months on ideas. Not investment advice. DYOR
Related publications
Disclaimer
The information and publications are not meant to be, and do not constitute, financial, investment, trading, or other types of advice or recommendations supplied or endorsed by TradingView. Read more in the Terms of Use.
BTC
bc1q2eckdzh0q8vsd7swcc8et6ze7s99khhxyl7zwy
Weblink: patreon.com/withoutworries
Allow 3-6 months on ideas. Not investment advice. DYOR
bc1q2eckdzh0q8vsd7swcc8et6ze7s99khhxyl7zwy
Weblink: patreon.com/withoutworries
Allow 3-6 months on ideas. Not investment advice. DYOR
Related publications
Disclaimer
The information and publications are not meant to be, and do not constitute, financial, investment, trading, or other types of advice or recommendations supplied or endorsed by TradingView. Read more in the Terms of Use.