The main trend. Logarithm. Time frame 1 week.
This time frame is more for orientation, where the price (area to work or monitor now) is in the main trend and what is the potential for price decrease/increase from its values now. The exception, this work and analysis is for investors and position traders with large capital, who are not interested in short-term and medium-term price movements for a small %.
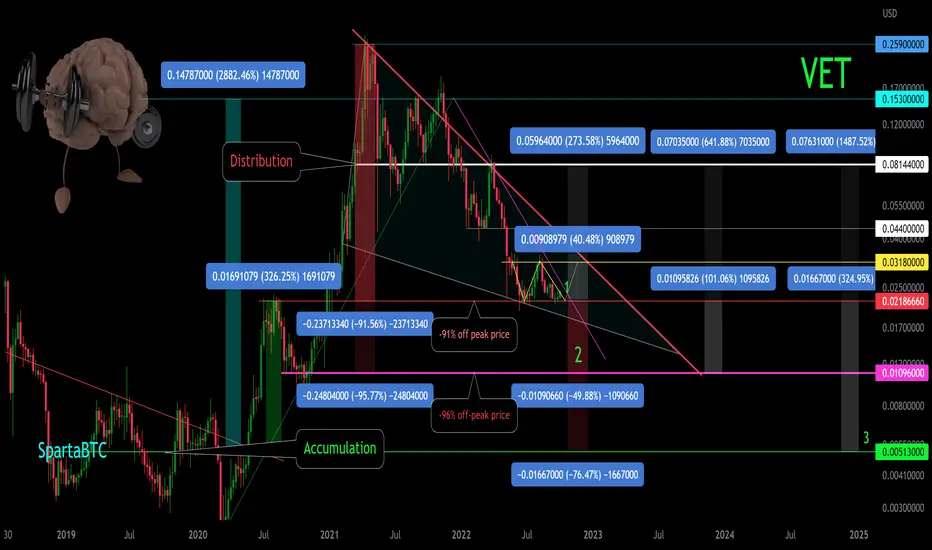
The average prices of the accumulation and distribution zones of the last cycle are marked. Previously actively traded this coin, the previous ideas fixed under this trading idea.
Secondary trend — downward wedge.
Local trend — a potential double bottom in the case of holding the existing support.
Decrease from the price peak -91%.
Profit from the average price of the last accumulation +320% at the moment.
Short work.
I would like to point out that the coin, unlike many cryptocurrencies, is in substantial profit. In case the existing support breaks through, there is a prospect of shorting to the designated reversal zones.
Work in the long.
I have marked the reversal zone support levels and percentage of them to the resistance zones.
Linear chart. Time frame is the same.


Secondary trend.
This time frame is more for orientation, where the price (area to work or monitor now) is in the main trend and what is the potential for price decrease/increase from its values now. The exception, this work and analysis is for investors and position traders with large capital, who are not interested in short-term and medium-term price movements for a small %.
The average prices of the accumulation and distribution zones of the last cycle are marked. Previously actively traded this coin, the previous ideas fixed under this trading idea.
Secondary trend — downward wedge.
Local trend — a potential double bottom in the case of holding the existing support.
Decrease from the price peak -91%.
Profit from the average price of the last accumulation +320% at the moment.
Short work.
I would like to point out that the coin, unlike many cryptocurrencies, is in substantial profit. In case the existing support breaks through, there is a prospect of shorting to the designated reversal zones.
Work in the long.
I have marked the reversal zone support levels and percentage of them to the resistance zones.
Linear chart. Time frame is the same.
Secondary trend.
Note

Note
Trade closed: target reached
It is a very aggressive "stick" dump. It is important, for the continuation of the uptrend development is the price fixation above this resistance level, possibly through a pullback to the dynamic support of the big bowl (if there is a significant correction in the market). Coin on super profit funds, but very HYIP among the crypto community and youtube bloggers. Just be mindful of this and observe mani management in your work.
Trade active
✅ Telegram. Finance + Trading: t.me/SpartaBTC_1318
✅ Telegram. Сrypto trading only: t.me/SpartaBTC_tradingview
✅ Instagram: instagram.com/spartabtc_1318
✅ YouTube (Rus): goo.su/vpRzRa2
✅ Telegram. Сrypto trading only: t.me/SpartaBTC_tradingview
✅ Instagram: instagram.com/spartabtc_1318
✅ YouTube (Rus): goo.su/vpRzRa2
Related publications
Disclaimer
The information and publications are not meant to be, and do not constitute, financial, investment, trading, or other types of advice or recommendations supplied or endorsed by TradingView. Read more in the Terms of Use.