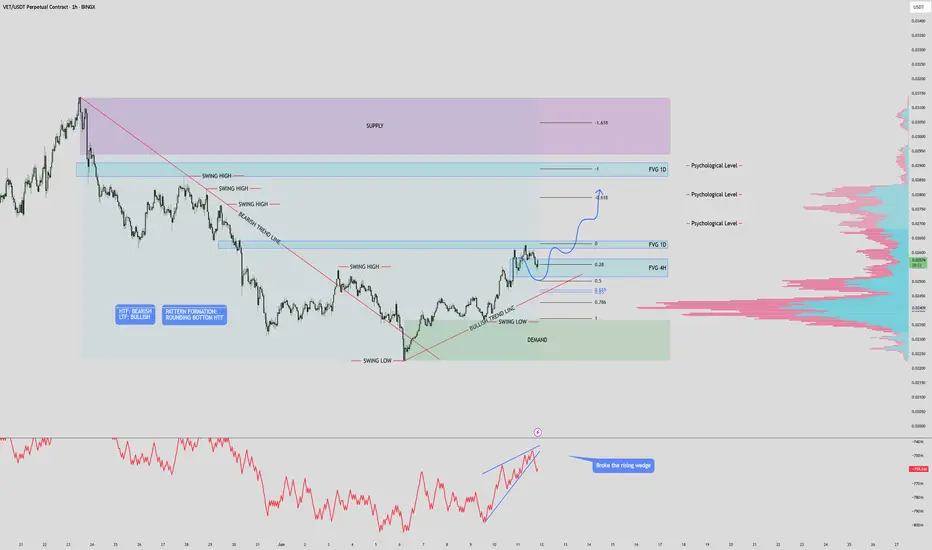
Structure & Zones
Price is trading between a clear supply zone above and a demand zone below, offering defined areas for reaction.
Two unfilled FVGs on the 1D timeframe above current price could act as magnet zones for price continuation.
A 4H FVG just beneath current price is nearly filled — potential area for a bullish bounce.
Three psychological price levels are marked and align with Fibonacci and FVG targets, likely to act as resistance zones if price pushes higher.
Trend & Pattern
High timeframe (HTF) remains bullish, supported by the formation of a rounding bottom — a strong reversal structure suggesting accumulation.
Lower timeframe (LTF) is showing short-term bearishness as price pulls back and retests key support/trendline.
Price is holding above a bullish trendline, maintaining structure unless a breakdown occurs.
Volume & Momentum
The OBV indicator shows a broken rising wedge, signaling a possible momentum slowdown or short-term correction.
Anchored volume profile reveals high volume beneath price — indicating that previous trading activity supports current levels and adds bullish confluence.
Outlook & Trade Consideration
Bias remains bullish overall, supported by HTF structure and unfilled FVG targets above.
A potential pullback into the 0.5–0.618 fib retracement zone or into the 4H FVG could present long entry opportunities.
On continuation, price may target the daily FVGs and psychological levels as resistance or take-profit zones.
Watch for a rejection at fib/psych levels or breakdown below the bullish trendline to reassess bias.
Order cancelled
Unfortunately due to the war, no entries were hit and analysis became invalid.
Disclaimer
The information and publications are not meant to be, and do not constitute, financial, investment, trading, or other types of advice or recommendations supplied or endorsed by TradingView. Read more in the Terms of Use.
Disclaimer
The information and publications are not meant to be, and do not constitute, financial, investment, trading, or other types of advice or recommendations supplied or endorsed by TradingView. Read more in the Terms of Use.