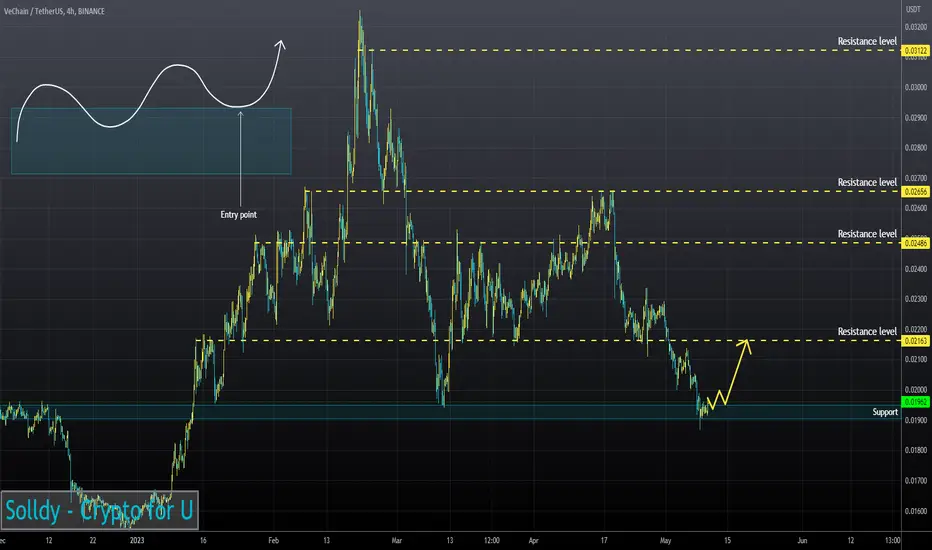
The RSI chart, price movement and trading volume dynamics formed a bullish divergence on the 4H Timeframe.
VET broke up 50EMA on 1H Timeframe.
The RSI chart returned to the buyers' zone at 1H and 30H TFs.
The price will bounce off the support again.
VET broke up 50EMA on 1H Timeframe.
The RSI chart returned to the buyers' zone at 1H and 30H TFs.
The price will bounce off the support again.
Disclaimer
The information and publications are not meant to be, and do not constitute, financial, investment, trading, or other types of advice or recommendations supplied or endorsed by TradingView. Read more in the Terms of Use.
Disclaimer
The information and publications are not meant to be, and do not constitute, financial, investment, trading, or other types of advice or recommendations supplied or endorsed by TradingView. Read more in the Terms of Use.