Hello?
Dear Traders, Nice to meet you.
"Like" is a great power for me.
By "following" you can always get new information quickly.
Thank you for always supporting.
--------------------------------------
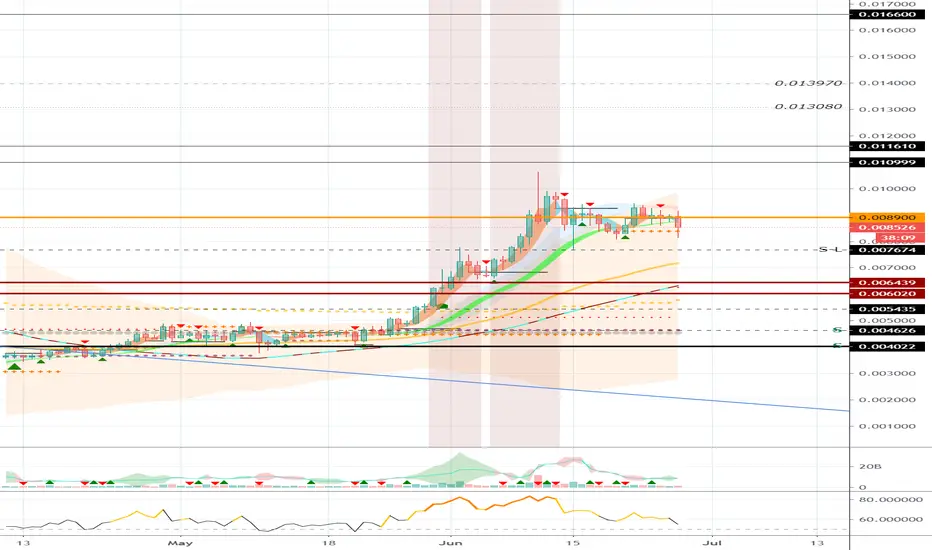
It is declining without support above the 0.008900 point.
We need to check if we can rise above the 0.008900 point.
In order to create a new wave, you need to see support from above 0.008900.
I think that the section from 0.006020 to 0.006439 corresponds to the waist section from the low section.
If this section goes down from top to bottom, it becomes Stop-Loss, and if it goes up, I think it is a buying section.
-------------------------------------------------- ----------------------
** Check support, resistance and abbreviation points.
** Support or resistance is based on the closing price of the 1D chart.
** All descriptions are for reference only and do not guarantee profit or loss on investment.
Description of abbreviations shown in chart
R: A resistance point or section where a response is needed to preserve revenue
S-L: Stop-Loss point or section
S: A point or section that can be purchased for profit generation as a support point or section
Dear Traders, Nice to meet you.
"Like" is a great power for me.
By "following" you can always get new information quickly.
Thank you for always supporting.
--------------------------------------
It is declining without support above the 0.008900 point.
We need to check if we can rise above the 0.008900 point.
In order to create a new wave, you need to see support from above 0.008900.
I think that the section from 0.006020 to 0.006439 corresponds to the waist section from the low section.
If this section goes down from top to bottom, it becomes Stop-Loss, and if it goes up, I think it is a buying section.
-------------------------------------------------- ----------------------
** Check support, resistance and abbreviation points.
** Support or resistance is based on the closing price of the 1D chart.
** All descriptions are for reference only and do not guarantee profit or loss on investment.
Description of abbreviations shown in chart
R: A resistance point or section where a response is needed to preserve revenue
S-L: Stop-Loss point or section
S: A point or section that can be purchased for profit generation as a support point or section
Note
I think the 10.9 point is near the waist of the VET.
If you go beyond this point, I don't think you can actually know where to go.
You should always trade according to the flow of the chart.
Note
The above update is the VETKRW chart description.Sorry for not posting well.
I think the 0.0089 point is around the waist of the VET.
If you can gain support by rising above the 0.0089 point, I think there's a good chance of a big rise.
You should always trade according to the flow of the chart.
Note
It started to rise at the 0.008900 point and rose above the 0.011610 point.
You need to make sure you can get support in the 0.010999~0.011610 section.
Note
(VETUSDT 1W chart)It is rising above the expected point of 0.0166 due to a sharp rise.
You need to make sure you can get support at 0.0166.
We need to see if we can rise above 0.022980 to complete the largest'U' in the period seen in this chart.
New entry from the current location is not recommended.
※ Follow X to check out the posts.
※ X를 팔로우하고 게시물을 확인하세요.
◆ t.me/readCryptoChannel
[HA-MS Indicator]
bit.ly/3YxHgvN
[OBV Indicator]
bit.ly/4dcyny3
※ X를 팔로우하고 게시물을 확인하세요.
◆ t.me/readCryptoChannel
[HA-MS Indicator]
bit.ly/3YxHgvN
[OBV Indicator]
bit.ly/4dcyny3
Related publications
Disclaimer
The information and publications are not meant to be, and do not constitute, financial, investment, trading, or other types of advice or recommendations supplied or endorsed by TradingView. Read more in the Terms of Use.