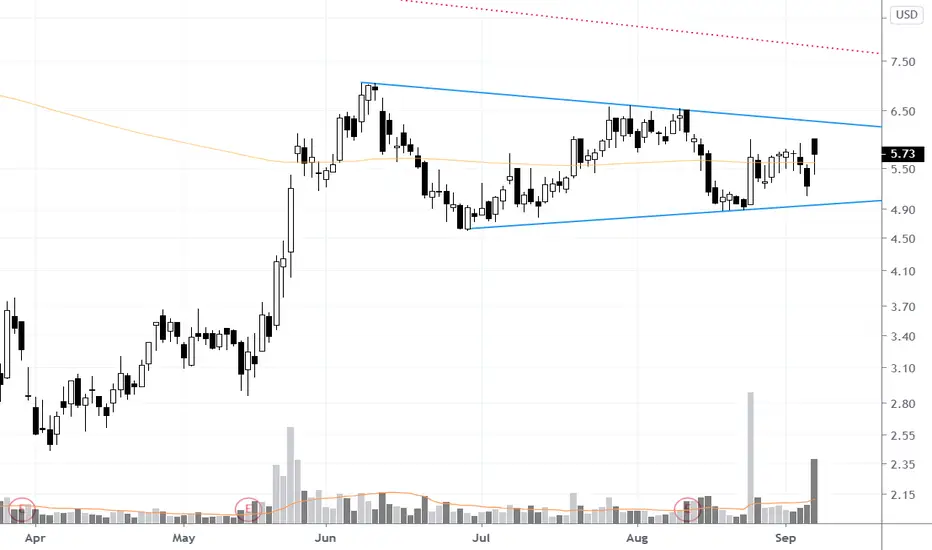
Up 10% today in the face of a market that's been selling off. Watch the weekly down trending line (red on the chart) if a breakout takes place. Could see some selling in that area but that's 20%+ from breakout boundary.
Order cancelled
the setup never triggered and the symmetrical triangle has been violated to the downside. no long setup here anymore.✔ Momentum & Breakout Trader Since 2006 | Influenced by Mark Minervini VCP Trading Style & William O'Neil CANSLIM 📈
✔ Follow me on Twitter @taplot - twitter.com/TaPlot
✔ YouTube channel youtube.com/@taplot
✔ Follow me on Twitter @taplot - twitter.com/TaPlot
✔ YouTube channel youtube.com/@taplot
Disclaimer
The information and publications are not meant to be, and do not constitute, financial, investment, trading, or other types of advice or recommendations supplied or endorsed by TradingView. Read more in the Terms of Use.
✔ Momentum & Breakout Trader Since 2006 | Influenced by Mark Minervini VCP Trading Style & William O'Neil CANSLIM 📈
✔ Follow me on Twitter @taplot - twitter.com/TaPlot
✔ YouTube channel youtube.com/@taplot
✔ Follow me on Twitter @taplot - twitter.com/TaPlot
✔ YouTube channel youtube.com/@taplot
Disclaimer
The information and publications are not meant to be, and do not constitute, financial, investment, trading, or other types of advice or recommendations supplied or endorsed by TradingView. Read more in the Terms of Use.