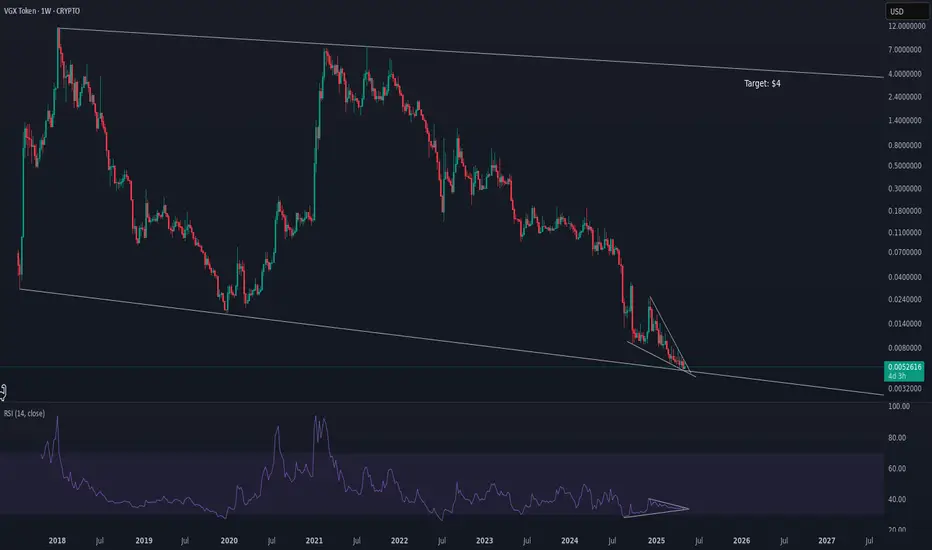
VGX is currently showing signs of a bullish divergence at the lower band of its ongoing downtrend. On the 1W timeframe, both RSI and MACD are indicating a shift in momentum toward buyers, even as the price continues to print lower lows.
The price has repeatedly tested a key support zone and is now showing potential for a short-term reversal.
If confirmed by volume and a break above immediate resistance, this divergence could lead to a strong upward move.
🎯 Target: $4
🛑 Stop Loss: Below the lower band of the current structure
Not financial advice – trade safe and manage your risk.
Disclaimer
The information and publications are not meant to be, and do not constitute, financial, investment, trading, or other types of advice or recommendations supplied or endorsed by TradingView. Read more in the Terms of Use.
Disclaimer
The information and publications are not meant to be, and do not constitute, financial, investment, trading, or other types of advice or recommendations supplied or endorsed by TradingView. Read more in the Terms of Use.