Long
Is Voyager token about to print a 300% move?
I know, dead project. However this is a great example why Technical Analysis trumps fundamentals.
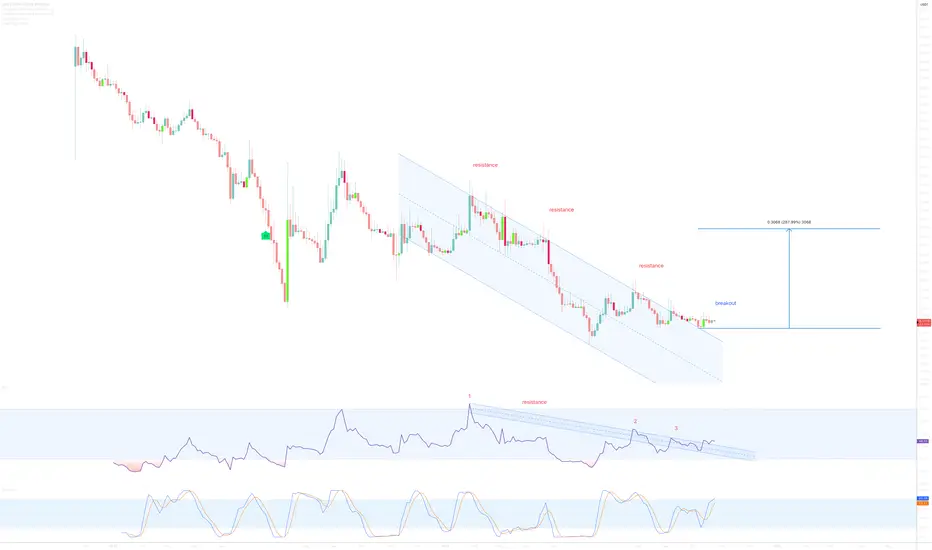
On the above 3-day chart price action has corrected 98%. A number of reasons now exist to have a long position. They include:
1) Price action and RSI resistance breakouts.
2) Price action and RSI confirms support on past resistance.
3) The bull flag breakout measures a near 300% target.
4) Does anyone know why I’ve written the numbers on the RSI resistance? Answers below!
Is it possible price action falls further? Sure.
Is it probable? no
Ww
Type: trade
Risk: 1-2%
Timeframe: Long this month
Return: 2-3x
BTC
bc1q2eckdzh0q8vsd7swcc8et6ze7s99khhxyl7zwy
Weblink: patreon.com/withoutworries
Allow 3-6 months on ideas. Not investment advice. DYOR
bc1q2eckdzh0q8vsd7swcc8et6ze7s99khhxyl7zwy
Weblink: patreon.com/withoutworries
Allow 3-6 months on ideas. Not investment advice. DYOR
Disclaimer
The information and publications are not meant to be, and do not constitute, financial, investment, trading, or other types of advice or recommendations supplied or endorsed by TradingView. Read more in the Terms of Use.