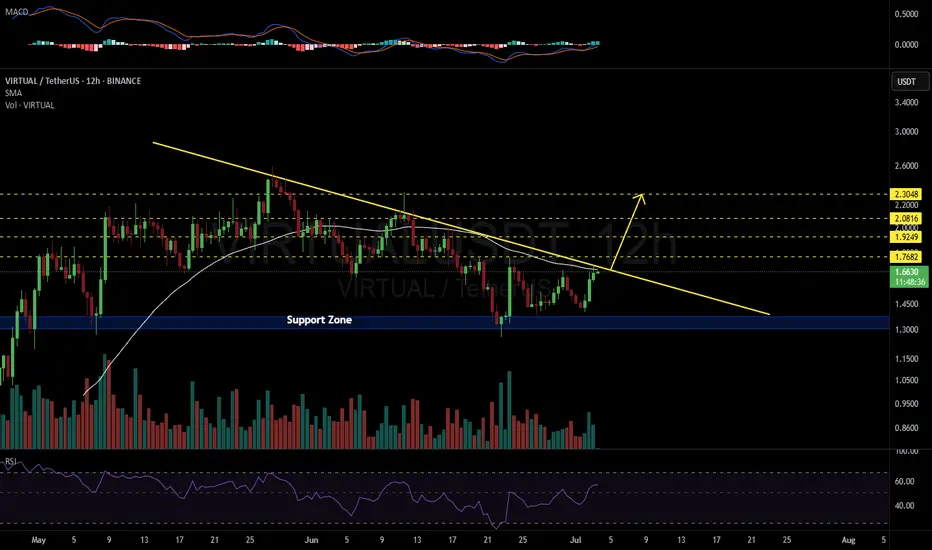
Keep an eye on the #VIRTUAL 12H timeframe chart. In case of a breakout above the descending resistance and the 12H SMA50, the targets are:
🎯 $1.7682
🎯 $1.9249
🎯 $2.0816
🎯 $2.3048
⚠️ As always, use a tight stop-loss and apply proper risk management.
🎯 $1.7682
🎯 $1.9249
🎯 $2.0816
🎯 $2.3048
⚠️ As always, use a tight stop-loss and apply proper risk management.
Disclaimer
The information and publications are not meant to be, and do not constitute, financial, investment, trading, or other types of advice or recommendations supplied or endorsed by TradingView. Read more in the Terms of Use.
Disclaimer
The information and publications are not meant to be, and do not constitute, financial, investment, trading, or other types of advice or recommendations supplied or endorsed by TradingView. Read more in the Terms of Use.