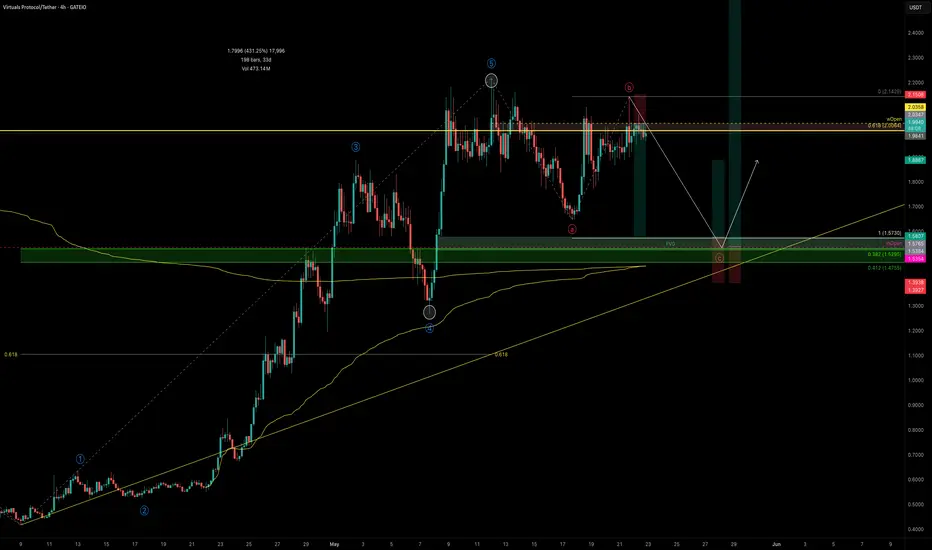
VIRTUAL has been on fire! Printing a clean 5-wave Elliott impulse with a +431% run in just 33 days. But after every strong trend comes a healthy correction, and that’s where we likely are now. Trading below key resistance and showing signs of exhaustion. The question: Where is the next high probability trade setup?
Let’s break down what the chart is telling us.
🧠 Structure Overview
A corrective Wave C is likely underway, and all signs point toward a very specific zone.
⚠️ Liquidity Dynamics
The longer VIRTUAL grinds sideways near $2.00 without showing real momentum, the more vulnerable late long positions become:
🔍 The $1.58–$1.47 Support Cluster: 14 Layers of Confluence
This zone isn’t guesswork — it’s loaded with technical overlap:
1️⃣ 1:1 Trend-Based Fib Extension of Wave A → $1.573
2️⃣ Monthly Open → $1.5354
3️⃣ 0.382 Fib Retracement of the entire rally → $1.5295
4️⃣ Bullish Fair Value Gap → $1.57–$1.53
5️⃣ Anchored VWAP from ATH → ~$1.46
6️⃣ Anchored VWAP from Wave 3 → ~$1.46
7️⃣ 0.618 Fib Speed Fan Support (~end of May timing)
8️⃣ 4H 233 SMA → ~$1.52
9️⃣ 4H 200 EMA → ~$1.52
🔟 Daily 200 SMA → $1.5251
1️⃣1️⃣ Weekly 21 SMA → $1.462 (reinforces the VWAP zone)
1️⃣2️⃣ Declining Daily Volume → momentum weakening
1️⃣3️⃣ Liquidity Pool below Wave A → likely to be swept
1️⃣4️⃣ $2 = Golden Pocket Resistance + Psychological Barrier
🔴 Short Trade Setup (Active as Long as SFP Holds)
For those favouring downside continuation toward the Wave C target, a short setup is in play:
As long as price remains below the SFP and the $2.00 golden pocket resistance, bears maintain control.
🟢 Long Trade Setup
👉 Bonus TP for Harmonic Setup: 0.618 Fib of CD leg
✨ Bonus Confluence: Potential bullish Gartley Harmonic in Play
VIRTUAL is also forming a valid Gartley harmonic pattern — one of the most reliable reversal setups in classical trading theory.

🔸 XA: B retraced to 0.602 → ✅ (criterion: ~0.618)
🔸 AB: C retraced 0.87 → ✅ (valid range: 0.382–0.886)
🔸 CD: Projected to complete at 0.786 of XA → ~$1.474
• CD is a 1.356 expansion of BC
• AB ≈ CD symmetry is valid
• TP = 0.618 retracement of CD leg
This adds even more weight to the $1.47–$1.53 buy zone.
📘 Educational Takeaway
The best setups don’t rely on one method — they align multiple disciplines. Here, we have Elliott Waves, Fibonacci retracements, anchored VWAPs, volume structure, moving averages, time symmetry, and now a harmonic pattern — all pointing to the same opportunity. Most traders never wait for alignment. That’s why most lose.
💬 Final Words
✍️ Smart trading isn’t about always being in a trade — it’s about being in the right one at the right time.
While others FOMO at $2, you wait for the right opportunity to come to you — where structure, liquidity, and probability all shake hands.
The patient are rewarded. Always.
___________________________________
If you found this helpful, leave a like and comment below! Got requests for the next technical analysis? Let me know.
Let’s break down what the chart is telling us.
🧠 Structure Overview
- Wave 5 peaked at $2.2169
- Wave A dropped -25%
- Wave B bounced +30%
- Currently: VIRTUAL's trading under the $2 psychological level and weekly open ($2.0358) → signs of momentum cooling
A corrective Wave C is likely underway, and all signs point toward a very specific zone.
⚠️ Liquidity Dynamics
The longer VIRTUAL grinds sideways near $2.00 without showing real momentum, the more vulnerable late long positions become:
- Retail traders are buying resistance
- SLs are likely clustered just below Wave A’s low
- This creates a liquidity pocket waiting to be swept — perfect fuel for Wave C
🔍 The $1.58–$1.47 Support Cluster: 14 Layers of Confluence
This zone isn’t guesswork — it’s loaded with technical overlap:
1️⃣ 1:1 Trend-Based Fib Extension of Wave A → $1.573
2️⃣ Monthly Open → $1.5354
3️⃣ 0.382 Fib Retracement of the entire rally → $1.5295
4️⃣ Bullish Fair Value Gap → $1.57–$1.53
5️⃣ Anchored VWAP from ATH → ~$1.46
6️⃣ Anchored VWAP from Wave 3 → ~$1.46
7️⃣ 0.618 Fib Speed Fan Support (~end of May timing)
8️⃣ 4H 233 SMA → ~$1.52
9️⃣ 4H 200 EMA → ~$1.52
🔟 Daily 200 SMA → $1.5251
1️⃣1️⃣ Weekly 21 SMA → $1.462 (reinforces the VWAP zone)
1️⃣2️⃣ Declining Daily Volume → momentum weakening
1️⃣3️⃣ Liquidity Pool below Wave A → likely to be swept
1️⃣4️⃣ $2 = Golden Pocket Resistance + Psychological Barrier
🔴 Short Trade Setup (Active as Long as SFP Holds)
For those favouring downside continuation toward the Wave C target, a short setup is in play:
- Entry: Weekly open retest around $2.0358
- Stop-loss: Above SFP high at $2.143
- Target: 1:1 Trend-Based Fib Extension of Wave A → $1.573 or the Swing Low of Wave A at $1.647
- R:R ≈ 1:4 — a solid, well-structured short opportunity
As long as price remains below the SFP and the $2.00 golden pocket resistance, bears maintain control.
🟢 Long Trade Setup
- Entry: Ladder between $1.58–$1.47
- Avg. Entry: ~$1.53
- SL: Below $1.40
- TP1: $1.88 (local resistance) → R:R ≈ 1:2.5
- TP2: $3.33 (0.618 Fib of entire bear market) → R:R ≈ 1:12
👉 Bonus TP for Harmonic Setup: 0.618 Fib of CD leg
✨ Bonus Confluence: Potential bullish Gartley Harmonic in Play
VIRTUAL is also forming a valid Gartley harmonic pattern — one of the most reliable reversal setups in classical trading theory.
🔸 XA: B retraced to 0.602 → ✅ (criterion: ~0.618)
🔸 AB: C retraced 0.87 → ✅ (valid range: 0.382–0.886)
🔸 CD: Projected to complete at 0.786 of XA → ~$1.474
• CD is a 1.356 expansion of BC
• AB ≈ CD symmetry is valid
• TP = 0.618 retracement of CD leg
This adds even more weight to the $1.47–$1.53 buy zone.
📘 Educational Takeaway
The best setups don’t rely on one method — they align multiple disciplines. Here, we have Elliott Waves, Fibonacci retracements, anchored VWAPs, volume structure, moving averages, time symmetry, and now a harmonic pattern — all pointing to the same opportunity. Most traders never wait for alignment. That’s why most lose.
💬 Final Words
✍️ Smart trading isn’t about always being in a trade — it’s about being in the right one at the right time.
While others FOMO at $2, you wait for the right opportunity to come to you — where structure, liquidity, and probability all shake hands.
The patient are rewarded. Always.
___________________________________
If you found this helpful, leave a like and comment below! Got requests for the next technical analysis? Let me know.
Order cancelled
📢 Quick Update on VIRTUAL:VIRTUAL broke back above the weekly open and just swept the $2.2169 high — now trading right at that level.
Short setup has been invalidated, and the harmonic pattern is no longer in play.
Time to reassess and wait for the next high-probability setup. Stay sharp.
Note
🚨 VIRTUAL Update — May 25📘 Education Insight: Why SFPs Are One of the Best Trade Setups
A Swing Failure Pattern (SFP) happens when price briefly breaks above a key high (or below a key low), grabs liquidity, then sharply reverses — trapping breakout traders and triggering stop-losses. It’s a classic move that smart money uses to exploit emotional entries.
Here’s what makes SFPs so effective:
1️⃣ Liquidity Magnets — They often occur where stop-losses cluster, meaning they’re fueled by smart money liquidity grabs.
2️⃣ Clear Risk — The invalidation point is obvious (the wick high/low), allowing for precise stop placement.
3️⃣ High R:R Potential — Once the trap is sprung, price often reverses fast, giving strong reward relative to risk.
4️⃣ Versatile — SFPs show up on all timeframes — 15-minute or daily, the concept holds.
5️⃣ Even Stronger with Confluence — When SFPs align with key levels (Fibs, VWAPs, Order Blocks), they become extremely high probability.
🧠 Bonus Insight: SFPs work because they exploit retail psychology. Price fakes out in one direction, triggers stop orders, then violently reverses — emotion meets precision. That’s opportunity.
But timing matters.
In VIRTUAL’s case, the SFP at $2.1429 looked valid — but price was still trending upward. It was above the anchored VWAP from $1.647, holding higher highs and higher lows, and still respecting its local golden pocket. That’s not a place to short without further confirmation like structure breaks or lower highs forming.
Then came the next SFP — a cleaner one. Price swept the $2.2169 high, with a retest and sharply rejected. That second move was the true low-risk short opportunity — a clear liquidity grab followed by confirmation.
🎯 What’s Next?
The long setup remains intact. Price is likely heading lower to shake out late longs who chased the highs. Keep an eye on:
🔹 $1.772 — sell-side liquidity
🔹 $1.647 — key sell-side liquidity
🔹 $1.551 — 0.382 Fib retracement of the entire move, a potential long entry zone
Wait for structure and confirmation before jumping in.
🧠 Key Takeaway:
🔹 Don't short into strength without confirmation.
🔹 Watch for SFPs — they often offer low-risk, high-reward trade setups.
🔹 Let the structure break — then act.
🔹 Use tools like anchored VWAP, Fib levels, and SFPs together.
🔹 The best trades come where structure, timing, and psychology all align.
🏆 Mastering Fibonacci for precision trading
🔹 Sharing high-probability trade setups
⚡ Unlock the power of technical analysis!
🔹 Sharing high-probability trade setups
⚡ Unlock the power of technical analysis!
Related publications
Disclaimer
The information and publications are not meant to be, and do not constitute, financial, investment, trading, or other types of advice or recommendations supplied or endorsed by TradingView. Read more in the Terms of Use.