🔍 Overview: Bearish Pressure, But Structure Holds
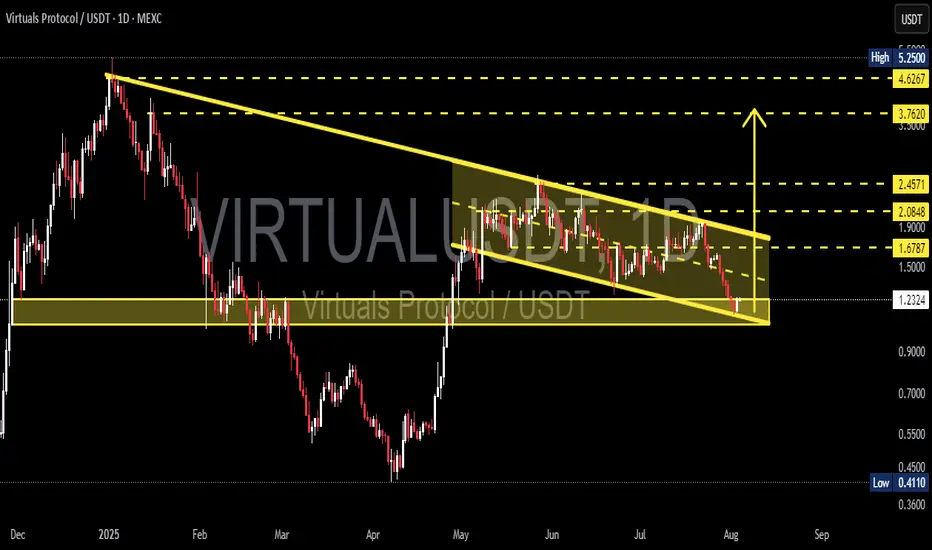
VIRTUAL/USDT is currently consolidating within a well-defined Descending Channel pattern that has been forming since early May 2025. While the trend is bearish, price action remains within a controlled structure — a potential sign of hidden accumulation or smart-money positioning.
What makes this setup compelling is that price has just touched the lower boundary of the channel while also interacting with a historical demand zone around 1.20–1.25 USDT, which previously triggered a strong rally back in May.
---
🧠 Key Technical Pattern: Descending Channel + Historical Demand Zone
Descending Channel → Suggests consistent selling pressure but within a structured range — no real breakdown yet.
Demand Zone (1.20 – 1.25 USDT) → A historically strong support level that has launched sharp upward moves in the past.
Decreasing Volume → Could indicate weakening bearish momentum as price approaches key support.
---
📈 Bullish Scenario (Bounce from Support):
If the price manages to hold and forms a reversal signal (such as a bullish engulfing or hammer candle), we could see a relief rally toward key resistance levels.
🎯 Potential Bullish Targets:
1. 1.6787 USDT – Mid-channel resistance
2. 1.9000 USDT – Psychological and structural resistance
3. 2.0848 – 2.4571 USDT – Horizontal resistance zone and top of the channel
4. 3.7620 – 4.6267 USDT – Extended targets if breakout occurs with volume
📌 Bullish Confirmation Needed: A strong breakout above the channel midpoint + increasing volume to confirm a potential trend reversal.
---
📉 Bearish Scenario (Breakdown from Channel):
If the price fails to hold above the 1.20–1.25 support and breaks below the channel support, we may see increased selling pressure and a continuation of the downtrend.
🎯 Downside Targets:
1.00 USDT – Psychological support
0.90 – 0.70 USDT – Previous accumulation range
0.4110 USDT – All-time low and ultimate downside target
🚨 A strong breakdown with high volume could trigger panic selling and a prolonged bearish leg.
---
🎯 Conclusion:
> VIRTUAL/USDT is at a pivotal decision point — hold and bounce, or break and slide.
The structure is still intact, and the price is testing two critical technical zones simultaneously: the descending channel support and a major demand area.
This is not the time to chase price, but to observe and prepare for confirmation. A strong signal here could set the tone for the next major move.
#VirtualUSDT #CryptoTechnicalAnalysis #DescendingChannel #DemandZone #ReversalSignal #AltcoinAnalysis #CryptoTradingSetup #PriceActionTrading #SupportResistance
✅ Get Free Signals! Join Our Telegram Channel Here: t.me/TheCryptoNuclear
✅ Twitter: twitter.com/crypto_nuclear
✅ Join Bybit : partner.bybit.com/b/nuclearvip
✅ Benefits : Lifetime Trading Fee Discount -50%
✅ Twitter: twitter.com/crypto_nuclear
✅ Join Bybit : partner.bybit.com/b/nuclearvip
✅ Benefits : Lifetime Trading Fee Discount -50%
Disclaimer
The information and publications are not meant to be, and do not constitute, financial, investment, trading, or other types of advice or recommendations supplied or endorsed by TradingView. Read more in the Terms of Use.