Virtuals Protocol has experienced an astronomical +16,850% surge in price over the past 164 days, marking a parabolic advance that appears to be nearing exhaustion. Price action suggests that the final 5th wave of this bullish cycle may be completing, raising the question: Is Virtuals Protocol set for a correction, or is there still upside potential?
Key Observations:
1.) End of the 5th Wave:
2.) Weekly RSI Overbought:
3.) 6 Consecutive Bullish Weekly Candles:
4.) Fibonacci Target and Weekly Open Confluence:
Outlook:
Conclusion:
Virtuals Protocol is flashing clear signs of exhaustion, with extreme weekly RSI levels and a completed Elliott Wave cycle. Traders should watch the $2.711 zone closely as a potential correction target, with the 0.618 Fibonacci retracement and Weekly Open providing strong confluence.
Key Observations:
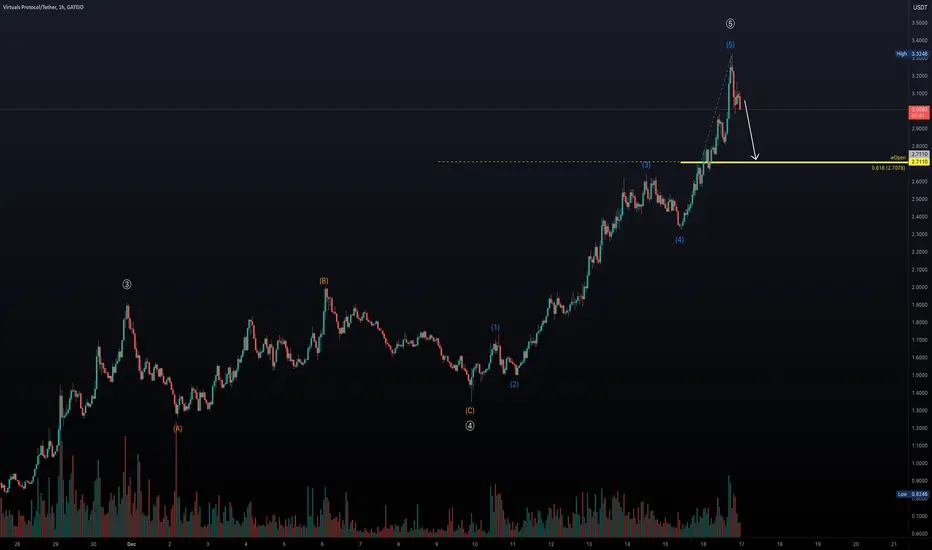
1.) End of the 5th Wave:
- The Elliott Wave count indicates that the asset is likely completing the final 5th wave of a large bullish cycle.
- Parabolic moves of this magnitude typically end with a sharp correction as profit-taking accelerates.
2.) Weekly RSI Overbought:
- The RSI on the weekly timeframe is at 95, signaling extreme overbought conditions.
- Such elevated RSI levels are unsustainable and often precede corrections to reset market momentum.
3.) 6 Consecutive Bullish Weekly Candles:
- A string of 6 green weekly candles suggests strong bullish momentum but also hints at exhaustion as buyers may struggle to sustain such momentum.
4.) Fibonacci Target and Weekly Open Confluence:
- Using a Fibonacci retracement from the current wave, the 0.618 level aligns perfectly with the Weekly Open (wOpen) at $2.711.
- This confluence zone serves as a strong short-term take-profit target for short sellers or a potential re-entry point for bulls looking for a correction.
Outlook:
- Bearish Scenario: The completion of the 5th wave and the extreme overbought RSI suggest a correction is imminent. A retrace towards the 0.618 Fib level ($2.711) is a highly probable scenario.
- Bullish Continuation: For further upside, the price must consolidate and find fresh buying volume to support continuation beyond the current highs.
Conclusion:
Virtuals Protocol is flashing clear signs of exhaustion, with extreme weekly RSI levels and a completed Elliott Wave cycle. Traders should watch the $2.711 zone closely as a potential correction target, with the 0.618 Fibonacci retracement and Weekly Open providing strong confluence.
🏆 Mastering Fibonacci for precision trading
🔹 Sharing high-probability trade setups
⚡ Unlock the power of technical analysis!
🔹 Sharing high-probability trade setups
⚡ Unlock the power of technical analysis!
Disclaimer
The information and publications are not meant to be, and do not constitute, financial, investment, trading, or other types of advice or recommendations supplied or endorsed by TradingView. Read more in the Terms of Use.