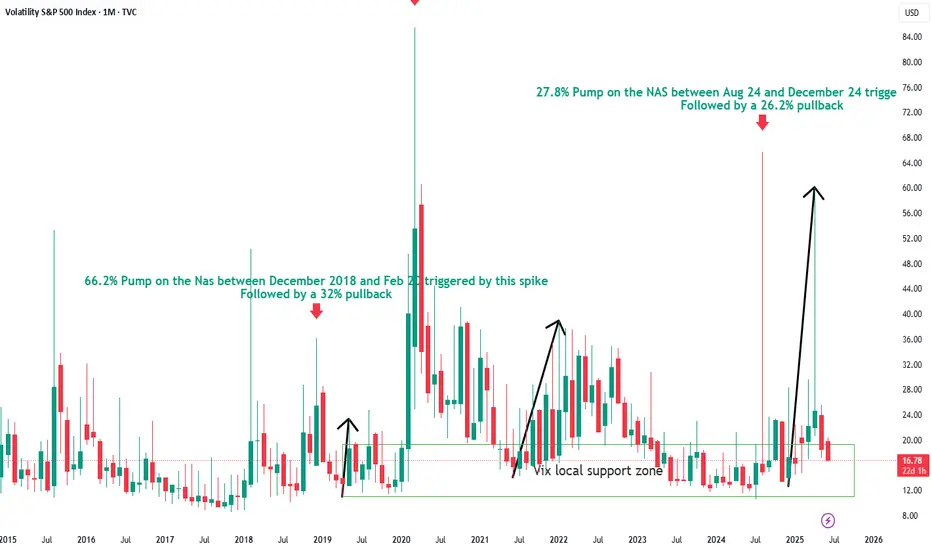
The last three big rallies on the NASDAQ were initiated by large volatility spikes on the VIX.
Followed by an average decline of 32%.
Following the NAS tanking 26% from Feb to April 25, Price has already entered into a support zone on the VIX, which has triggered all 3 of the last crashes.
The NAS rally since the April 7th 25 has been on DECLINING VOLUME on the Daily Chart.
This post is not attempting to be a BULL vs BEAR debate. Or is it an attempt to prove or disprove any particular trading strategy. You do you and trade what you see and keep winning....
BUT
From a Macro perspective, speculating on pivot points requires much deeper MTF analysis and confluence than simple trendlines, H or L indications or RSI readings.
This is an elementary attempt at macro liquidity mapping using NAS volume and VIX volatility as an compass.
With all that said, the likelihood of a sustained rally from here looks very low IMHO...
As a minimum, ALL OF THE GAPS FROM APRIL 7TH will need to be filled IMHO
Disclaimer
The information and publications are not meant to be, and do not constitute, financial, investment, trading, or other types of advice or recommendations supplied or endorsed by TradingView. Read more in the Terms of Use.
Disclaimer
The information and publications are not meant to be, and do not constitute, financial, investment, trading, or other types of advice or recommendations supplied or endorsed by TradingView. Read more in the Terms of Use.