https://tradingview.sweetlogin.com/x/r9uEK9Af/
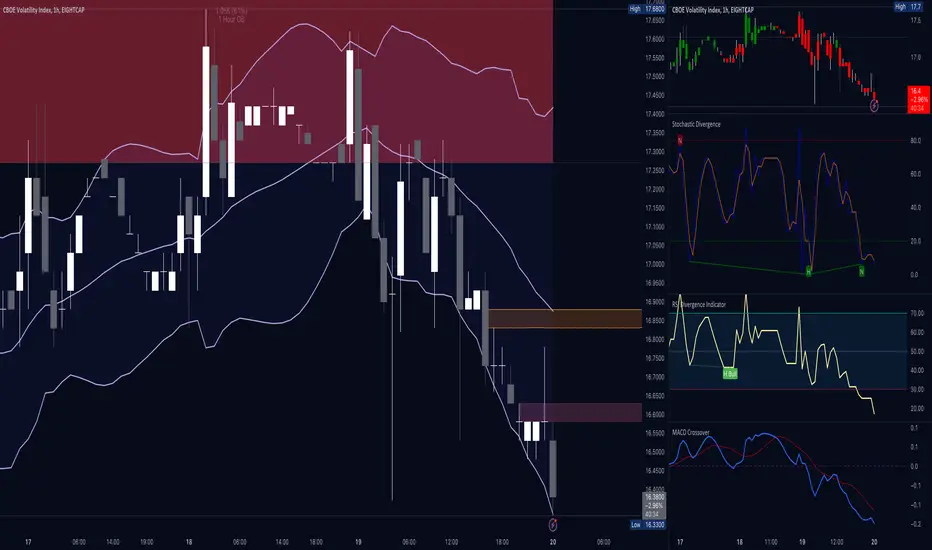
A chart of the VIX Index a few moments ago, this 1hr chart with Bollinger-bands shows where its hourly Candle is positioned currently at the bottom of bands, a reversal could be imminent and market volatility.
A chart of the VIX Index a few moments ago, this 1hr chart with Bollinger-bands shows where its hourly Candle is positioned currently at the bottom of bands, a reversal could be imminent and market volatility.
Disclaimer
The information and publications are not meant to be, and do not constitute, financial, investment, trading, or other types of advice or recommendations supplied or endorsed by TradingView. Read more in the Terms of Use.
Disclaimer
The information and publications are not meant to be, and do not constitute, financial, investment, trading, or other types of advice or recommendations supplied or endorsed by TradingView. Read more in the Terms of Use.