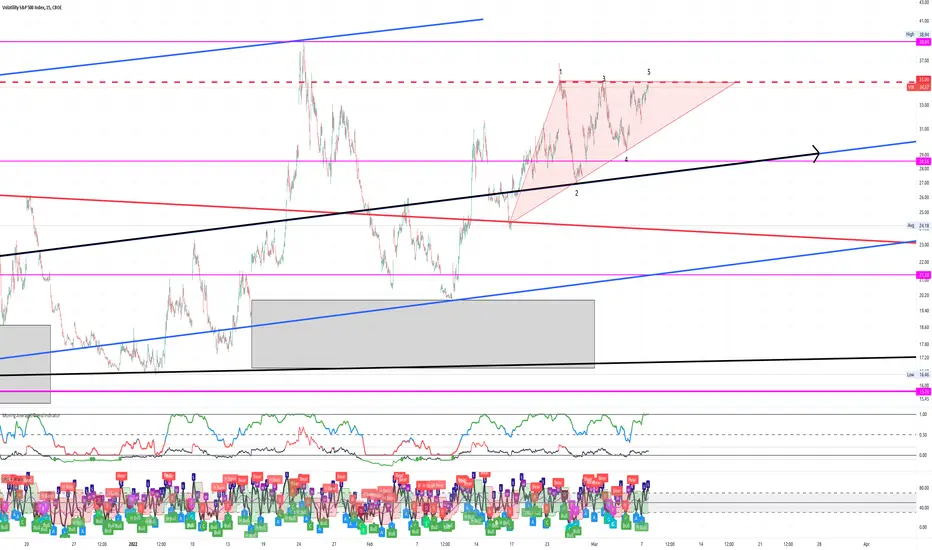
VIX looks to be exhibiting a bullish ascending triangle pattern. This could mean we are about to see a big drop in major indices in the next week or so (look back at 2018). Look for confirmation of it breaking out above the flat top and maybe a retest (resistance becomes support) before making a big move up.


Note
End of day it looks to be a breakout.Related publications
Disclaimer
The information and publications are not meant to be, and do not constitute, financial, investment, trading, or other types of advice or recommendations supplied or endorsed by TradingView. Read more in the Terms of Use.
Related publications
Disclaimer
The information and publications are not meant to be, and do not constitute, financial, investment, trading, or other types of advice or recommendations supplied or endorsed by TradingView. Read more in the Terms of Use.