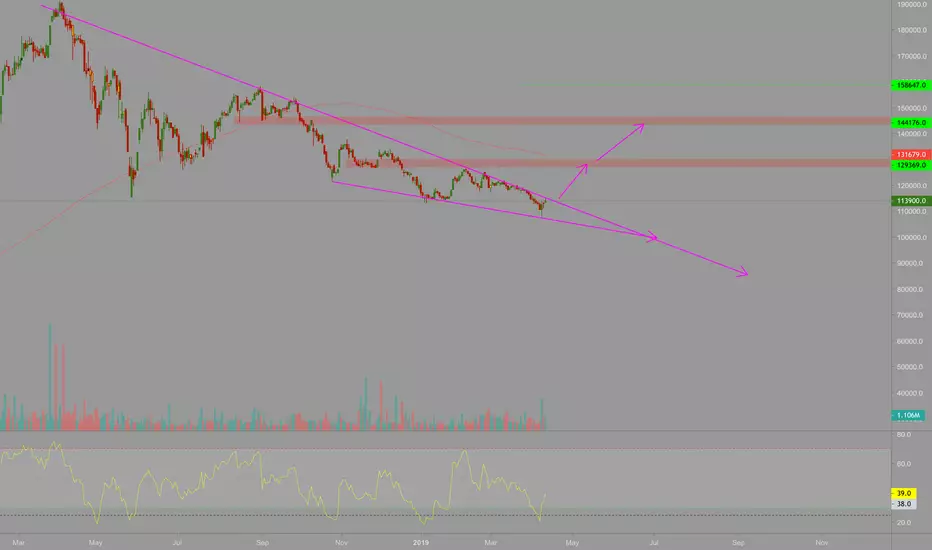
Long VJC and take profit with Tp1 and Tp2 with green line
Trade closed: target reached
Hit Tp1Trade closed: stop reached
Touch TP2Follow the Structure, not the Trend.
Point & Figure Chart with Supply & Demand Zones.
==================================
📈 X (Twitter): @pnftrading
💬 Telegram: @pnftrading
Web: pnftrading.com
Point & Figure Chart with Supply & Demand Zones.
==================================
📈 X (Twitter): @pnftrading
💬 Telegram: @pnftrading
Web: pnftrading.com
Disclaimer
The information and publications are not meant to be, and do not constitute, financial, investment, trading, or other types of advice or recommendations supplied or endorsed by TradingView. Read more in the Terms of Use.
Follow the Structure, not the Trend.
Point & Figure Chart with Supply & Demand Zones.
==================================
📈 X (Twitter): @pnftrading
💬 Telegram: @pnftrading
Web: pnftrading.com
Point & Figure Chart with Supply & Demand Zones.
==================================
📈 X (Twitter): @pnftrading
💬 Telegram: @pnftrading
Web: pnftrading.com
Disclaimer
The information and publications are not meant to be, and do not constitute, financial, investment, trading, or other types of advice or recommendations supplied or endorsed by TradingView. Read more in the Terms of Use.