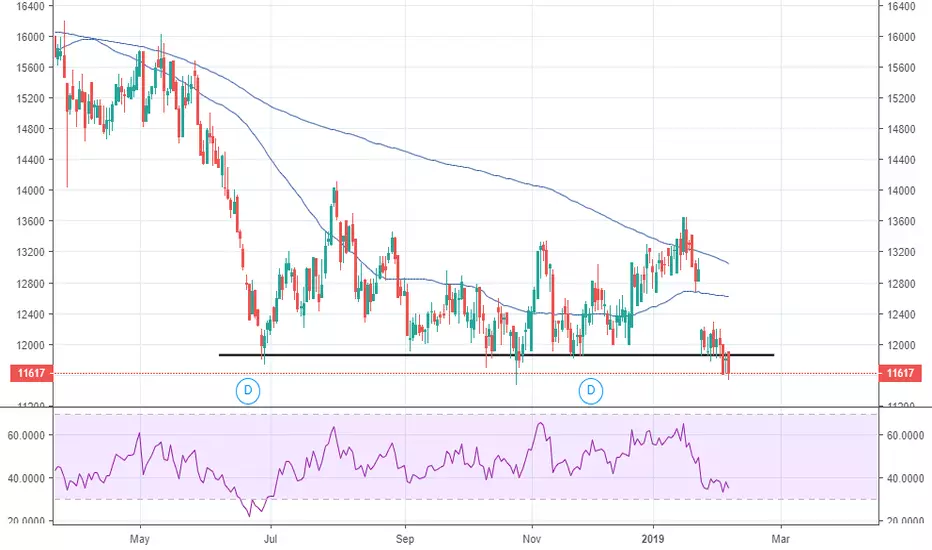
Daily chart shows price trying to break support around R118.
I'm monitoring for, 1st, a close below R118, and 2nd, for that R118 area to act as resistance.
Provisional entry levels, R115/R116; target R100.
I'm monitoring for, 1st, a close below R118, and 2nd, for that R118 area to act as resistance.
Provisional entry levels, R115/R116; target R100.
Note
On Monday (Feb 11) we saw a bullish engulfing candle, and the following day the price rallied, only to be stopped by the R118 resistance area (previous support).In Today's session (so far), we saw a high of R118.
I'm in the trade at R115, my target is still R100. A breach of the R118 area will be my signal to prepare for exit at R120.
Note
My 'Short' idea unfortunately hit SL last week.
But VOD is now 'breaking down' lower, hitting a low of R111.09 so far in today's session.
R100 is still insight in the Short/Medium term.
Disclaimer
The information and publications are not meant to be, and do not constitute, financial, investment, trading, or other types of advice or recommendations supplied or endorsed by TradingView. Read more in the Terms of Use.
Disclaimer
The information and publications are not meant to be, and do not constitute, financial, investment, trading, or other types of advice or recommendations supplied or endorsed by TradingView. Read more in the Terms of Use.