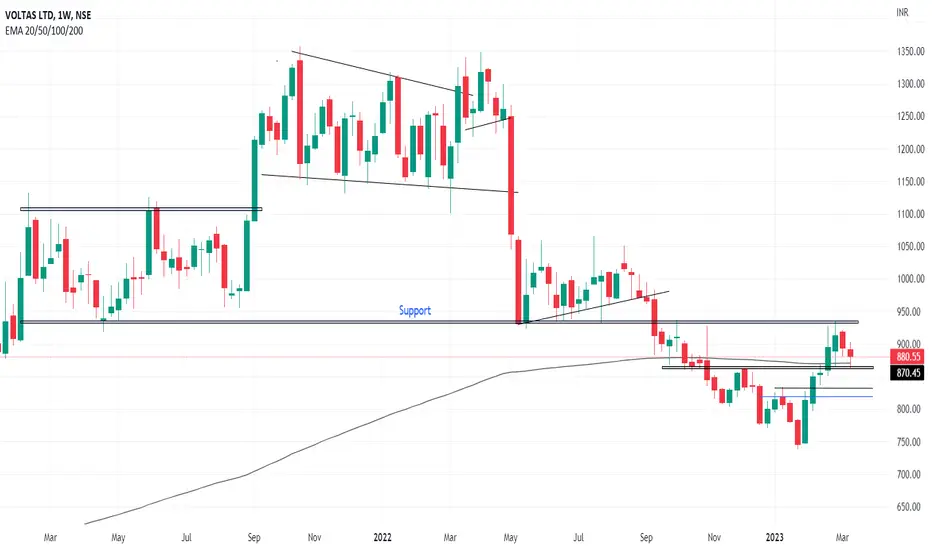
In the Weekly Chart of VOLTAS ,
we can see that, it is converted from down trend to Up trend.
It is holding strongly at 200 EMA.
Since 920-930 levels have been tested multiple times, we can see a further up move in coming weeks.
Go Long for VOLTAS.
we can see that, it is converted from down trend to Up trend.
It is holding strongly at 200 EMA.
Since 920-930 levels have been tested multiple times, we can see a further up move in coming weeks.
Go Long for VOLTAS.
Disclaimer
The information and publications are not meant to be, and do not constitute, financial, investment, trading, or other types of advice or recommendations supplied or endorsed by TradingView. Read more in the Terms of Use.
Disclaimer
The information and publications are not meant to be, and do not constitute, financial, investment, trading, or other types of advice or recommendations supplied or endorsed by TradingView. Read more in the Terms of Use.