Hello Friends,
Welcome to RK_Chaarts,
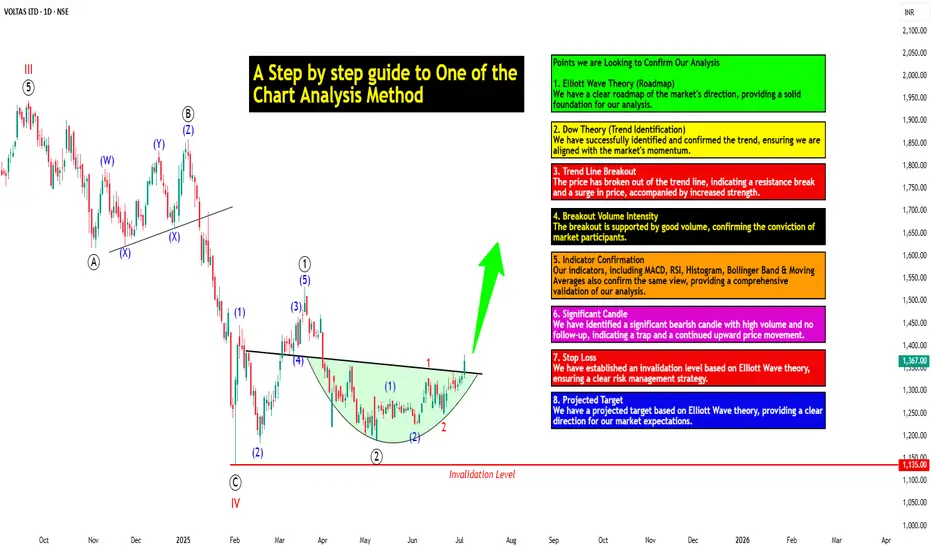
Today we're going to learn step-by-step guide to one of the chart analysis Method by analyzing a chart of " VOLTAS LTD. " to identify a trend change opportunity.(Educational Post).
Let's get started!
Applying Elliott Wave Theory
According to Elliott Wave theory, we can see that the high of September 20, 2024, marked the end of the wave III of the cycle degree in Red. After that, a corrective wave unfolded, which reached its low on February 1, 2025. This was the wave IV of the cycle degree in Red, with a low of 1135.
The approximately 6 months correction ended here, and now the wave V of the cycle degree in Red has begun. Within this, there will be five sub-divisions of primary degree in black, which we can label as waves ((1)) to ((5)). Of these, waves ((1)) and ((2)) are complete, and we are possibly now in wave ((3)) of the Primary degree in Black.
Within wave ((3)), there will be five sub-divisions of intermediate degree in blue, of which waves (1) and (2) are complete, and the (3)rd intermediate degree in Blue is underway. Within this, there will be five sub-divisions waves of minor degree in red, of which 1 and 2 are complete, and today we saw the breakout of the 3 of the (3).
Possibly, this is a momentum move according to Elliott Wave theory, which we can call the third of the third of the third.
Now that we have this low of wave IV at ₹1135, it should not go below this level according to Elliott Wave theory. If it does, our current wave count will be invalidated. That's why we have an invalidation level within Elliott Wave, which according to this chart is at ₹1135. This low should not be breached. If it is breached for any reason, we'll have to re-analyze our entire count, and the counts could be different.
However, if this low holds, then the minimum target for wave V, based on the projection of wave theory, would be at least 100% to 123% of the fall from top III to bottom IV, which could take it to around ₹2000 to ₹2100. Shown in chart image below
Possible Elliott Wave Counts on Daily Time Frame Along with Invalidation level & Target levels.

Dow Theory Suggests now Up Trend
After forming the top of wave III, we can see that the price has moved downwards in a pattern of lower highs and lower lows. However, after completing the bottom of wave IV, the price has started forming a pattern of higher highs and higher lows, indicating that an uptrend has begun.
This is a clear signal that supports our wave counts moving upwards, i.e., towards an impulse move, based on Dow theory. The successful completion of wave IV and the initiation of the higher highs and higher lows pattern suggest a strong bullish trend, and we can expect the price to continue moving upwards. Shown in chart image below

Breakout with good intensity of Volumes
In this chart, we've observed a rounding bottom type chart pattern, and today, we've seen a breakout above the upper resistance trend line. Today's candle volume is also significantly higher than the average. Shown in chart images below
Chart Pattern: Rounding Bottom

Resistance Trendline Breakout with Good Intensity of Volumes

Supporting Indicators & Moving Averages
Also we can see that the current price has closed above the 50-day EMA and 100-day EMA. Additionally, indicators like RSI is above 60 and showing momentum, MACD is positive and above the zero line, and the histogram is also showing a breakout. Shown in chart images below
Breakout above 50DEMA & 100DEMA

RSI Breakout above 60+ on Daily Time Frame

Bullish side Breakout in Histogram on Daily Time Frame

MACD running Positive & above zero line on Daily Time Frame

Bollinger Band on Weekly
If we look at the weekly time frame, the current week's candle is above the middle Bollinger Band, indicating that the price is above the 20-period simple moving average on the weekly time frame. which is very good sign. Shown in chart image below
Price Trading above 20 SMA on Weekly Time Frame (Mid.Bollinger Band)

Significant Observation in Price Action & Volumes
Before the breakout, the rounding bottom chart pattern that was forming at the bottom can be interpreted as accumulation, as a red bearish candle with high volume appeared, marking the highest volume. Notably, no candle has closed below the low of that candle since then.
Although a gap-down candle occurred, it opened and closed bullish, indicating no selling pressure below that level. The absence of bearish follow-up and the subsequent breakout today are significant observations, combining price action and volume. This is a positive sign suggesting the price may move upwards. Shown in chart image below

This is how chart analysis is done for investment purposes. We've seen many signs in our favor, and yet we still use a stop loss to prevent significant losses in case the stock or market moves unexpectedly. This is what stop loss is all about - minimizing potential losses.
We've also discussed the target projection based on Wave theory, 123.6% level, which we explained through an image. So, friends, I hope you've understood the entire conclusion and learned how to analyze charts using different methods, one of which we shared with you today.
I am not Sebi registered analyst.
My studies are for educational purpose only.
Please Consult your financial advisor before trading or investing.
I am not responsible for any kinds of your profits and your losses.
Most investors treat trading as a hobby because they have a full-time job doing something else.
However, If you treat trading like a business, it will pay you like a business.
If you treat like a hobby, hobbies don't pay, they cost you...!
Hope this post is helpful to community
Thanks
RK💕
Disclaimer and Risk Warning.
The analysis and discussion provided on in.tradingview.com/u/RK_Chaarts/ is intended for educational purposes only and should not be relied upon for trading decisions. RK_Chaarts is not an investment adviser and the information provided here should not be taken as professional investment advice. Before buying or selling any investments, securities, or precious metals, it is recommended that you conduct your own due diligence. RK_Chaarts does not share in your profits and will not take responsibility for any losses you may incur. So Please Consult your financial advisor before trading or investing.
Welcome to RK_Chaarts,
Today we're going to learn step-by-step guide to one of the chart analysis Method by analyzing a chart of " VOLTAS LTD. " to identify a trend change opportunity.(Educational Post).
Let's get started!
Applying Elliott Wave Theory
According to Elliott Wave theory, we can see that the high of September 20, 2024, marked the end of the wave III of the cycle degree in Red. After that, a corrective wave unfolded, which reached its low on February 1, 2025. This was the wave IV of the cycle degree in Red, with a low of 1135.
The approximately 6 months correction ended here, and now the wave V of the cycle degree in Red has begun. Within this, there will be five sub-divisions of primary degree in black, which we can label as waves ((1)) to ((5)). Of these, waves ((1)) and ((2)) are complete, and we are possibly now in wave ((3)) of the Primary degree in Black.
Within wave ((3)), there will be five sub-divisions of intermediate degree in blue, of which waves (1) and (2) are complete, and the (3)rd intermediate degree in Blue is underway. Within this, there will be five sub-divisions waves of minor degree in red, of which 1 and 2 are complete, and today we saw the breakout of the 3 of the (3).
Possibly, this is a momentum move according to Elliott Wave theory, which we can call the third of the third of the third.
Now that we have this low of wave IV at ₹1135, it should not go below this level according to Elliott Wave theory. If it does, our current wave count will be invalidated. That's why we have an invalidation level within Elliott Wave, which according to this chart is at ₹1135. This low should not be breached. If it is breached for any reason, we'll have to re-analyze our entire count, and the counts could be different.
However, if this low holds, then the minimum target for wave V, based on the projection of wave theory, would be at least 100% to 123% of the fall from top III to bottom IV, which could take it to around ₹2000 to ₹2100. Shown in chart image below
Possible Elliott Wave Counts on Daily Time Frame Along with Invalidation level & Target levels.
Dow Theory Suggests now Up Trend
After forming the top of wave III, we can see that the price has moved downwards in a pattern of lower highs and lower lows. However, after completing the bottom of wave IV, the price has started forming a pattern of higher highs and higher lows, indicating that an uptrend has begun.
This is a clear signal that supports our wave counts moving upwards, i.e., towards an impulse move, based on Dow theory. The successful completion of wave IV and the initiation of the higher highs and higher lows pattern suggest a strong bullish trend, and we can expect the price to continue moving upwards. Shown in chart image below
Breakout with good intensity of Volumes
In this chart, we've observed a rounding bottom type chart pattern, and today, we've seen a breakout above the upper resistance trend line. Today's candle volume is also significantly higher than the average. Shown in chart images below
Chart Pattern: Rounding Bottom
Resistance Trendline Breakout with Good Intensity of Volumes
Supporting Indicators & Moving Averages
Also we can see that the current price has closed above the 50-day EMA and 100-day EMA. Additionally, indicators like RSI is above 60 and showing momentum, MACD is positive and above the zero line, and the histogram is also showing a breakout. Shown in chart images below
Breakout above 50DEMA & 100DEMA
RSI Breakout above 60+ on Daily Time Frame
Bullish side Breakout in Histogram on Daily Time Frame
MACD running Positive & above zero line on Daily Time Frame
Bollinger Band on Weekly
If we look at the weekly time frame, the current week's candle is above the middle Bollinger Band, indicating that the price is above the 20-period simple moving average on the weekly time frame. which is very good sign. Shown in chart image below
Price Trading above 20 SMA on Weekly Time Frame (Mid.Bollinger Band)
Significant Observation in Price Action & Volumes
Before the breakout, the rounding bottom chart pattern that was forming at the bottom can be interpreted as accumulation, as a red bearish candle with high volume appeared, marking the highest volume. Notably, no candle has closed below the low of that candle since then.
Although a gap-down candle occurred, it opened and closed bullish, indicating no selling pressure below that level. The absence of bearish follow-up and the subsequent breakout today are significant observations, combining price action and volume. This is a positive sign suggesting the price may move upwards. Shown in chart image below
This is how chart analysis is done for investment purposes. We've seen many signs in our favor, and yet we still use a stop loss to prevent significant losses in case the stock or market moves unexpectedly. This is what stop loss is all about - minimizing potential losses.
We've also discussed the target projection based on Wave theory, 123.6% level, which we explained through an image. So, friends, I hope you've understood the entire conclusion and learned how to analyze charts using different methods, one of which we shared with you today.
I am not Sebi registered analyst.
My studies are for educational purpose only.
Please Consult your financial advisor before trading or investing.
I am not responsible for any kinds of your profits and your losses.
Most investors treat trading as a hobby because they have a full-time job doing something else.
However, If you treat trading like a business, it will pay you like a business.
If you treat like a hobby, hobbies don't pay, they cost you...!
Hope this post is helpful to community
Thanks
RK💕
Disclaimer and Risk Warning.
The analysis and discussion provided on in.tradingview.com/u/RK_Chaarts/ is intended for educational purposes only and should not be relied upon for trading decisions. RK_Chaarts is not an investment adviser and the information provided here should not be taken as professional investment advice. Before buying or selling any investments, securities, or precious metals, it is recommended that you conduct your own due diligence. RK_Chaarts does not share in your profits and will not take responsibility for any losses you may incur. So Please Consult your financial advisor before trading or investing.
YouTube: youtube.com/@rk_charts
Telegram : t.me/RK_Charts
Twitter : @charts_rk
Email : rkcharts@gmail. com
Disclaimer.
I am not sebi registered analyst.
My studies are for educational purpose only.
Telegram : t.me/RK_Charts
Twitter : @charts_rk
Email : rkcharts@gmail. com
Disclaimer.
I am not sebi registered analyst.
My studies are for educational purpose only.
Related publications
Disclaimer
The information and publications are not meant to be, and do not constitute, financial, investment, trading, or other types of advice or recommendations supplied or endorsed by TradingView. Read more in the Terms of Use.