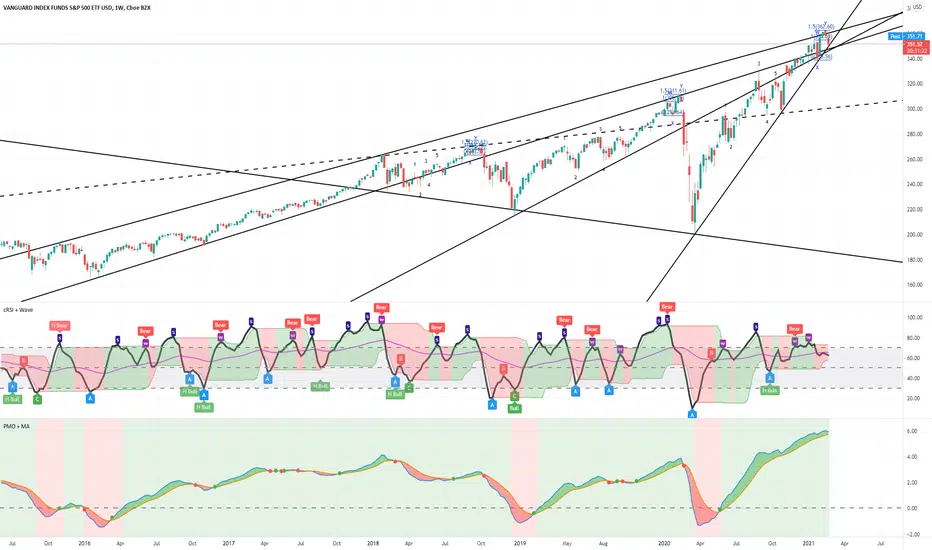
Just something I noticed today. Drew up what look like to be the key trend lines for the rallies over the last few years. I also noticed that each rally had a similar wave pattern throughout the middle (12345), a long almost pull back free middle, and then a WXZ with 1.5 fib ext at the end. Now, it is still too early to know if that pattern will hold now, but this down week does lend some credence to the idea.
Note that this in on the Vanguard S&P ETF, so the numbers are not perfectly aligned with the SPX or SPY.

2018

2019

2020

2021 at 4h

Hope it helps.
Note that this in on the Vanguard S&P ETF, so the numbers are not perfectly aligned with the SPX or SPY.
2018
2019
2020
2021 at 4h
Hope it helps.
Related publications
Disclaimer
The information and publications are not meant to be, and do not constitute, financial, investment, trading, or other types of advice or recommendations supplied or endorsed by TradingView. Read more in the Terms of Use.
Related publications
Disclaimer
The information and publications are not meant to be, and do not constitute, financial, investment, trading, or other types of advice or recommendations supplied or endorsed by TradingView. Read more in the Terms of Use.