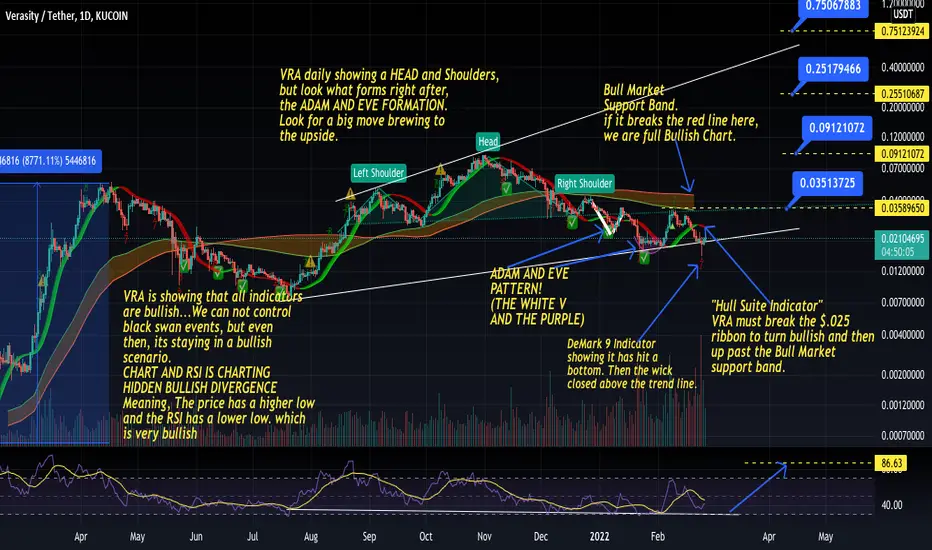
VRA is showing that all indicators
are bullish...We can not control
black swan events, but even
then, its staying in a bullish
scenario.
CHART AND RSI IS CHARTING
HIDDEN BULLISH DIVERGENCE
Meaning, The price has a higher low
and the RSI has a lower low. which
is very bullish. Zoom in to the chart
for all the details concerning
each indicator i can see.
Disclaimer
The information and publications are not meant to be, and do not constitute, financial, investment, trading, or other types of advice or recommendations supplied or endorsed by TradingView. Read more in the Terms of Use.
Disclaimer
The information and publications are not meant to be, and do not constitute, financial, investment, trading, or other types of advice or recommendations supplied or endorsed by TradingView. Read more in the Terms of Use.