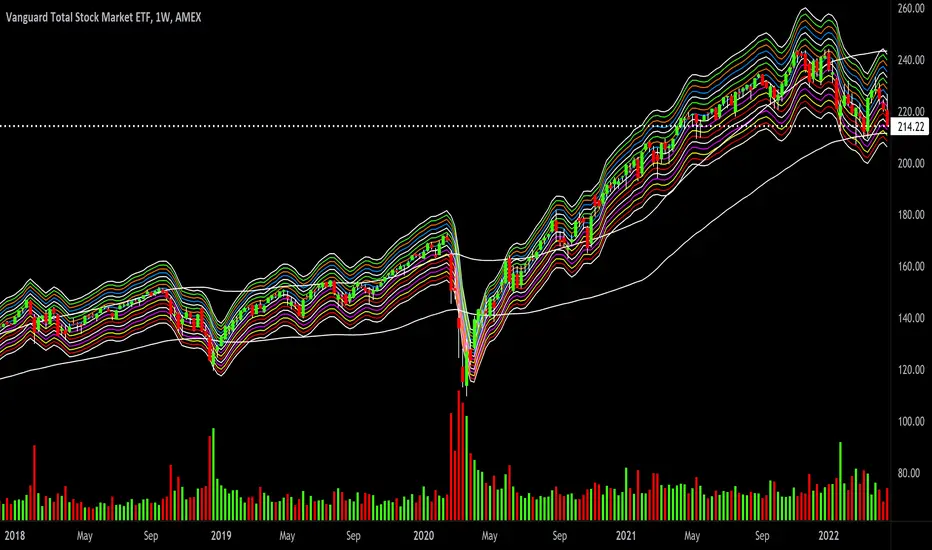
VTI is an ETF that includes the entire US equity market with 4,128 holdings. It's a great way to check the general overall tone of the United States stock markets. Here we have a 1 week chart, 4 year view, with my MTTC2.0 (still in beta) 17 levels set to SMA4 +-1% deviation per level, with the slow moving average envelope set to SMA50 with a +-8% deviation support & resistance. Technically, the US equity market (VTI) is very close to global support at $211.41 and $208.49 which is local support. The average of the two = $209.95, so if VTI gets to that level a logical technical plan would be to flip put hedges and go long with all calls until it gets back to pivot and then back to a 1 : 1 balanced hedge ratio. By my estimation that day is imminent as early as Monday or Tuesday 4/25 or 4/26. This past Friday was close, lol.
Do your own due diligence, your risk is 100% your responsibility. This is for educational and entertainment purposes only. You win some or you learn some. Consider being charitable with some of your profit to help humankind. Good luck and happy trading friends...
*3x lucky 7s of trading*
7pt Trading compass:
Price action, entry/exit
Volume average/direction
Trend, patterns, momentum
Newsworthy current events
Revenue
Earnings
Balance sheet
7 Common mistakes:
+5% portfolio trades, capital risk management
Beware of analyst's motives
Emotions & Opinions
FOMO : bad timing, the market is ruthless, be shrewd
Lack of planning & discipline
Forgetting restraint
Obdurate repetitive errors, no adaptation
7 Important tools:
Trading View app!, Brokerage UI
Accurate indicators & settings
Wide screen monitor/s
Trading log (pencil & graph paper)
Big, organized desk
Reading books, playing chess
Sorted watch-list
Checkout my indicators:
Fibonacci VIP - volume
Fibonacci MA7 - price
pi RSI - trend momentum
TTC - trend channel
AlertiT - notification
tickerTracker - MFI Oscillator
tradingview.com/u/growerik/
Note
*options use 100x leverage you could lose everything*There are many types of options trading strategies and positions, simple to sophisticated & hybrids. I group them into theta, delta or mix strategies and bull, bear or neutral positions. There's a buy side and sell side to every trade. If you check the open interest (OI), you can see how liquid it is. Check how wide the bid vs ask spread is.
Theta:
iron condor
iron fly
covered call
cash secured put
calendar spread
collar
Delta:
call
put
straddle
strangle
debit spread
credit spread
Bull:
call
put credit spread
call debit spread
cash secured put
Bear:
put
call credit spread
put debit spread
covered call
Neutral:
straddle
strangle
iron condor
iron fly
collar (often used for downside insurance)
calendar spread (short or long time)
Options important variables:
Strike = share price
itm, atm, otm = strike position
Expiry = Date of expiration
Value = H, L & Mark
Liquidity = bid vs ask spread
Direction = put or call
OI = open interest
V = volume
CP = chance of profit
IV = implied volatility
Delta = price
Theta = time
Vega = volatility
Gamma = momentum
Note
Bear trap incomingNote
Getting very close to the long triggerNote
So $209 global support is holding after all.Note
(VTI) US equity Market breaks 52 week lows.Trading indicators:
tradingview.com/u/Options360/
tradingview.com/u/Options360/
Disclaimer
The information and publications are not meant to be, and do not constitute, financial, investment, trading, or other types of advice or recommendations supplied or endorsed by TradingView. Read more in the Terms of Use.
Trading indicators:
tradingview.com/u/Options360/
tradingview.com/u/Options360/
Disclaimer
The information and publications are not meant to be, and do not constitute, financial, investment, trading, or other types of advice or recommendations supplied or endorsed by TradingView. Read more in the Terms of Use.