Long
WABI - Catching support, Possible Wave 5 set up
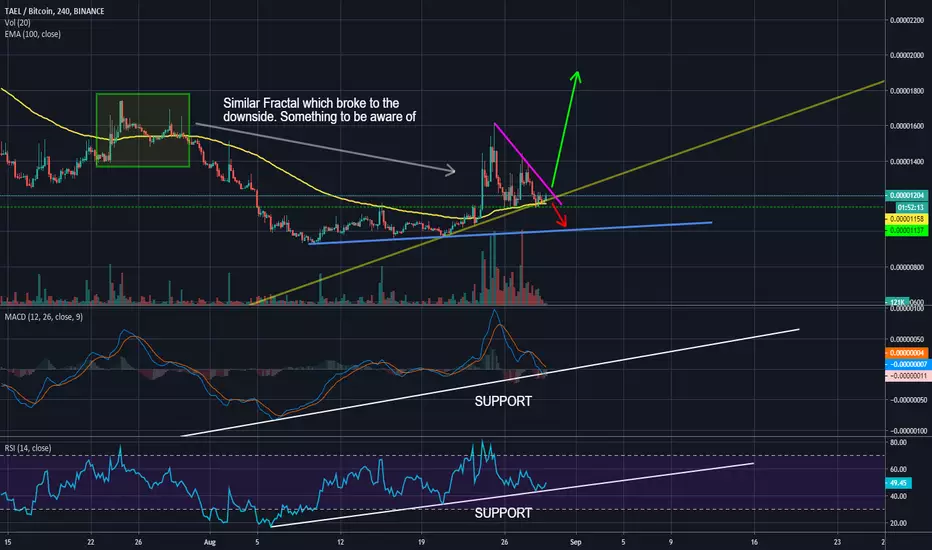
Taking a look at WABI's 4h chart, we can see it had a great jump a couple days ago. It has since had a healthy retrace beyond the .618 and is now sitting on support for both the price chart and indicators. The 100EMA is also supporting the price. I will be watching for a breakout. If we break the yellow uptrend, the foresee the price falling to the blue support line. There was a previous fractal that is similar to the one we have now that broke down and patterns often repeat, so be aware of the downside risk. Best to buy the breakout.
Note
Great volume and breakout, but running hot on the 30m. Be careful of a pull back within the pennant.
Disclaimer
The information and publications are not meant to be, and do not constitute, financial, investment, trading, or other types of advice or recommendations supplied or endorsed by TradingView. Read more in the Terms of Use.
Disclaimer
The information and publications are not meant to be, and do not constitute, financial, investment, trading, or other types of advice or recommendations supplied or endorsed by TradingView. Read more in the Terms of Use.