Hello Fellow Traders,
First of all, if you agree with this idea please give it a like. It will motivate me to keep on posting more content to you all. If you have idea’s than you can share them in the comments below!
History showed that it isn’t wise to predict if price will go up or down. You must take all possible outcomes in consideration. Everything is possible at any moment at any time.
I will share my thoughts of the current market situation and any possible targets ; bull and bear !
You can make your conclusion out this and make your own decision how to play it!
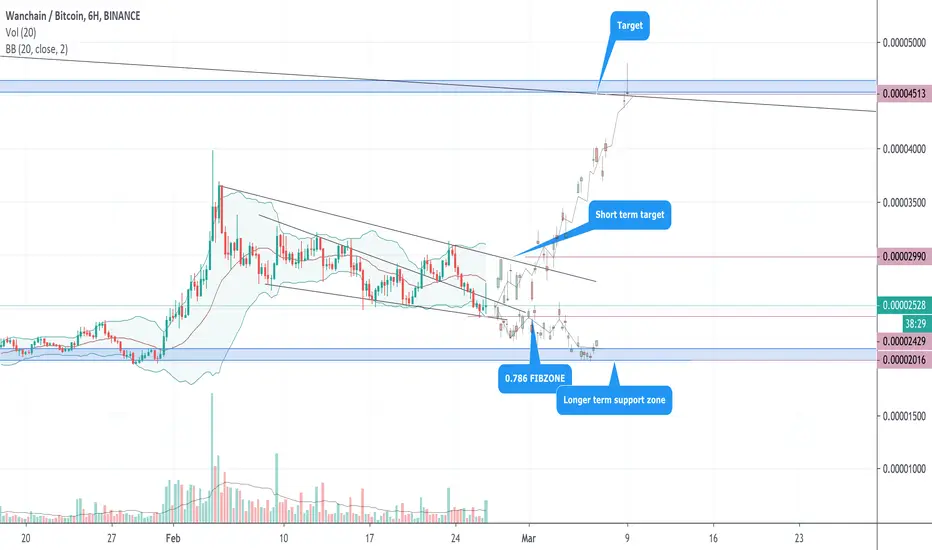
WAN recently was trading in a falling wedge pattern and we saw a break out, a retest but no follow through. This because of the drop of BTC.
Now it seems we are trading in a wider falling wedge pattern with a recent bounce off support. This zone align with the lower Bollinger band.
If we can hold support than a point of interested will be 0.00002990, if we can break that trendline than we might move to 0.00004513.
If we lose support the longer term support is @ 0.00002016
Do you have twitter? Let’s be friends! (link in bio)
- Cynocephalus volans -
First of all, if you agree with this idea please give it a like. It will motivate me to keep on posting more content to you all. If you have idea’s than you can share them in the comments below!
History showed that it isn’t wise to predict if price will go up or down. You must take all possible outcomes in consideration. Everything is possible at any moment at any time.
I will share my thoughts of the current market situation and any possible targets ; bull and bear !
You can make your conclusion out this and make your own decision how to play it!
WAN recently was trading in a falling wedge pattern and we saw a break out, a retest but no follow through. This because of the drop of BTC.
Now it seems we are trading in a wider falling wedge pattern with a recent bounce off support. This zone align with the lower Bollinger band.
If we can hold support than a point of interested will be 0.00002990, if we can break that trendline than we might move to 0.00004513.
If we lose support the longer term support is @ 0.00002016
Do you have twitter? Let’s be friends! (link in bio)
- Cynocephalus volans -
CHECK IT OUT 😎
⬇️⬇️⬇️
youtube.com/channel/UC_UP6XvTaTEKIapdM-aKzWA
twitter.com/TheChartingArt
⬇️⬇️⬇️
youtube.com/channel/UC_UP6XvTaTEKIapdM-aKzWA
twitter.com/TheChartingArt
Disclaimer
The information and publications are not meant to be, and do not constitute, financial, investment, trading, or other types of advice or recommendations supplied or endorsed by TradingView. Read more in the Terms of Use.
Disclaimer
The information and publications are not meant to be, and do not constitute, financial, investment, trading, or other types of advice or recommendations supplied or endorsed by TradingView. Read more in the Terms of Use.