Long
WAVES/USD W
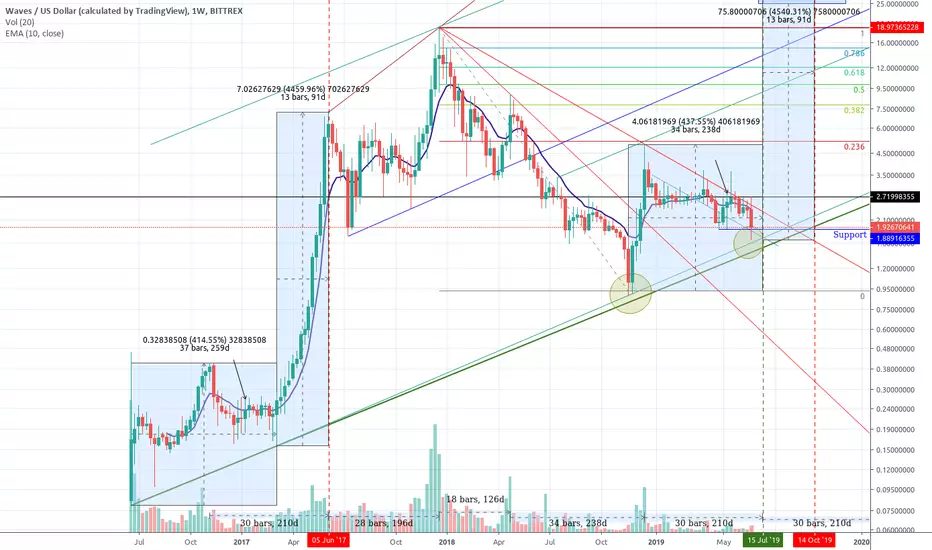
Looking at usd pair show that we might be at the bottom of the btc pair also. We got some sort of event playing out every 200ish day. And we are almost there. Note in the yellow circles and the new support line we do start curving up on the log scale. The arrow shows 1, 2, 3 break and close over EMA10.
If weekly candle closes under support line it will drop
So far so good.
this is no trade advice
If weekly candle closes under support line it will drop
So far so good.
this is no trade advice
Note
Trade active
Note
Ignore the close under support line. Going upNote
Edit: Do not ignore the close under supportDisclaimer
The information and publications are not meant to be, and do not constitute, financial, investment, trading, or other types of advice or recommendations supplied or endorsed by TradingView. Read more in the Terms of Use.
Disclaimer
The information and publications are not meant to be, and do not constitute, financial, investment, trading, or other types of advice or recommendations supplied or endorsed by TradingView. Read more in the Terms of Use.