Long
Waves to $30 - bullish divergence
So many opportunities at the moment. Will make this one quick…
Why Bullish?
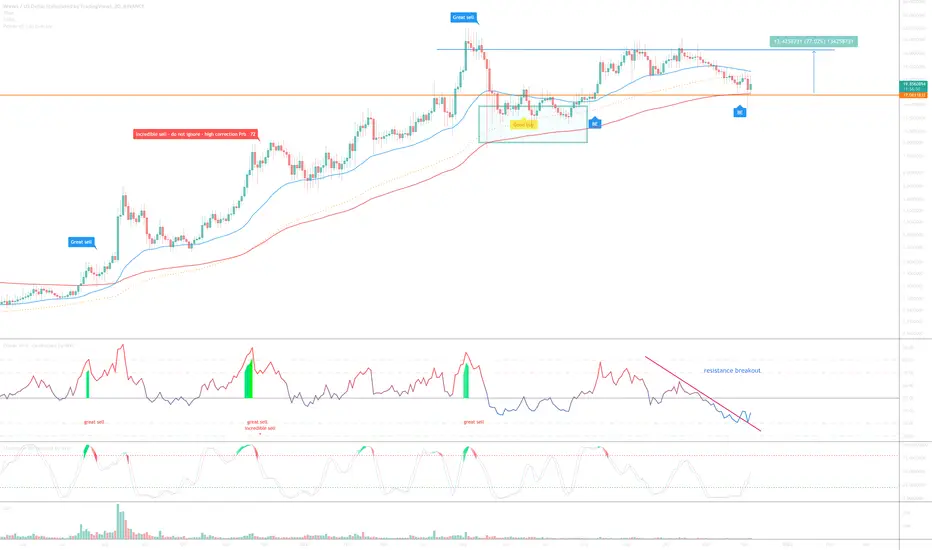
1) The ‘good buy’ on the above 2-day chart remains valid with price action currently testing past resistance as support.
2) Price action prints on the 2-day / 200-day EMA (red line) (actually 400 days), I use them on the 2-day during times of heightened volatility.
3) Bullish engulfing candle - look left !!
4) RSI resistance breakout.
Latterly on the 2-day BTC pair (below - green boxes):
1) A ‘great buy’ is printed. I don’t often time bottoms, but when I do ;) Look left.
2) 6! Six oscillators are printing regular bullish divergence.
Is it possible for price action to fall further? For sure, retail can’t sell fast enough at the moment.
Is it probable? 30% to be technical.
Good luck!
WW

Why Bullish?
1) The ‘good buy’ on the above 2-day chart remains valid with price action currently testing past resistance as support.
2) Price action prints on the 2-day / 200-day EMA (red line) (actually 400 days), I use them on the 2-day during times of heightened volatility.
3) Bullish engulfing candle - look left !!
4) RSI resistance breakout.
Latterly on the 2-day BTC pair (below - green boxes):
1) A ‘great buy’ is printed. I don’t often time bottoms, but when I do ;) Look left.
2) 6! Six oscillators are printing regular bullish divergence.
Is it possible for price action to fall further? For sure, retail can’t sell fast enough at the moment.
Is it probable? 30% to be technical.
Good luck!
WW
Note
Just noticed on the daily chart WAVES/BTC pair, 11 oscillators diverging with price action! If indeed it hits the upper resistance price action on the dollar chart should be closer to $40 not $30.Note
$14.70 would be an excellent entry point if you’re wanting to be long on this one. The buy signal was at $9. A conditional ‘great sell’ signal is printing, however, has not yet confirmed.Zooming out.. to the 4-day chart (below) the ‘incredible buy’ signal prints around $10. Look left for full details on what to expect next. $30-35 is likely to be the last resistance before a significant upward move to the $70-80 area, so don’t fret over timing between current price and $14, not worth the stress.
Trade active
A conditional sell signal is printing (green bar below - look left) but not yet confirmed as target approaches.Trade closed: target reached
A sell signal is now printing on the daily chart.BTC
bc1q2eckdzh0q8vsd7swcc8et6ze7s99khhxyl7zwy
Weblink: patreon.com/withoutworries
Allow 3-6 months on ideas. Not investment advice. DYOR
bc1q2eckdzh0q8vsd7swcc8et6ze7s99khhxyl7zwy
Weblink: patreon.com/withoutworries
Allow 3-6 months on ideas. Not investment advice. DYOR
Disclaimer
The information and publications are not meant to be, and do not constitute, financial, investment, trading, or other types of advice or recommendations supplied or endorsed by TradingView. Read more in the Terms of Use.
BTC
bc1q2eckdzh0q8vsd7swcc8et6ze7s99khhxyl7zwy
Weblink: patreon.com/withoutworries
Allow 3-6 months on ideas. Not investment advice. DYOR
bc1q2eckdzh0q8vsd7swcc8et6ze7s99khhxyl7zwy
Weblink: patreon.com/withoutworries
Allow 3-6 months on ideas. Not investment advice. DYOR
Disclaimer
The information and publications are not meant to be, and do not constitute, financial, investment, trading, or other types of advice or recommendations supplied or endorsed by TradingView. Read more in the Terms of Use.