Short
WAVESUSDT is testing the 1.518 Fibonacci level
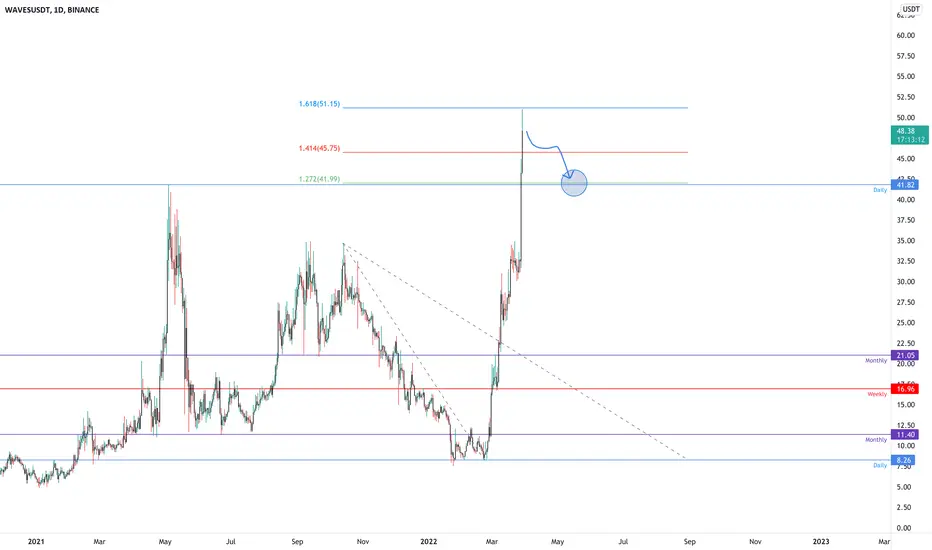
The price created a double bottom on the daily support on 8.26$ and got a lot of liquidity
Mow the price is testing the 1.618 Fibonacci level, so we could see a retracement until the previous ATH as new support
How to approach?
We are waiting for the retracement until the previous ATH as new support, and We analyze again for a new long position if the price is going to satisfy our rules
––––
Keep in mind.
🟣 Purple structure -> Monthly structure.
🔴 Red structure -> Weekly structure.
🔵 Blue structure -> Daily structure.
🟡 Yellow structure -> 4h structure.
Note
The price starts with the retracement. The valid support is 42$ so farNote
the price lost the support and it's melting32% so far
Note
The price needs to hold the 4h support or We could see a retest of the monthly support on 21$Note
38% so far.The Next valid support is 21$.
Note
We made more than 43% since my call. If the price is going to lose the 28$ support and the market is going to satisfy our rules, we could see a bearish impulse until the 21$
Note
53% so farTrade closed: target reached
76% Related publications
Disclaimer
The information and publications are not meant to be, and do not constitute, financial, investment, trading, or other types of advice or recommendations supplied or endorsed by TradingView. Read more in the Terms of Use.
Related publications
Disclaimer
The information and publications are not meant to be, and do not constitute, financial, investment, trading, or other types of advice or recommendations supplied or endorsed by TradingView. Read more in the Terms of Use.