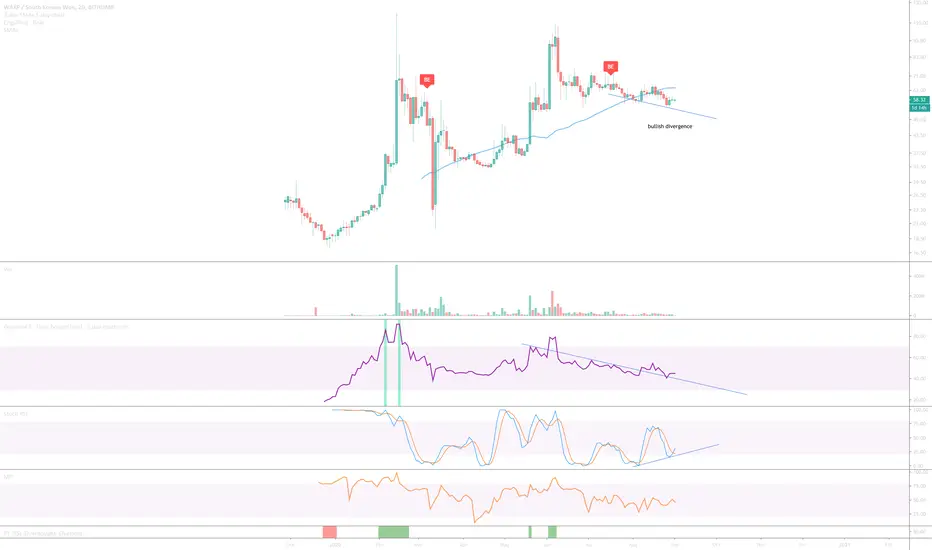
Using the South Korean won chart as there is more history! Nonetheless the 1-day USD chart is shown below. On the above 2-day chart we have:
1) Past RSI resistance has now become support.
2) Stochastic RSI makes higher highs with lower lows in price action = normal bullish divergence
3) Price action finds support on the 21-week moving average (see dollar chart below - green line).
There's not a huge amount of volume flowing into this project right now despite the divergence, however in my eyes this makes it a great opportunity to get in before it does come.
1-day USD chart showing 21-week moving average support

1-day BTC chart - Bullish engulfing candles following oversold period (orange and dark orange column)

1) Past RSI resistance has now become support.
2) Stochastic RSI makes higher highs with lower lows in price action = normal bullish divergence
3) Price action finds support on the 21-week moving average (see dollar chart below - green line).
There's not a huge amount of volume flowing into this project right now despite the divergence, however in my eyes this makes it a great opportunity to get in before it does come.
1-day USD chart showing 21-week moving average support
1-day BTC chart - Bullish engulfing candles following oversold period (orange and dark orange column)
Note
Bullish engulfing candle on the 2-day chart (bull+) as price action tests previous support.Note
Now up 550% and overbought. Profits should be taken at those levels.Trade active
The BTC chart against KRW/USD/EUR is looking very bullish. The symmetrical triangle should breakout soon enough, 2-3x BTC return minimum.Trade active
Binance listingNote
** swing trade opportunity **Price action is currently overbought printing a 'great sell' (green bar below), although it is not yet confirmed on the weekly chart (below, but has done on the daily.) Look left, expect a significant pullback.
BTC
bc1q2eckdzh0q8vsd7swcc8et6ze7s99khhxyl7zwy
Weblink: patreon.com/withoutworries
Allow 3-6 months on ideas. Not investment advice. DYOR
bc1q2eckdzh0q8vsd7swcc8et6ze7s99khhxyl7zwy
Weblink: patreon.com/withoutworries
Allow 3-6 months on ideas. Not investment advice. DYOR
Disclaimer
The information and publications are not meant to be, and do not constitute, financial, investment, trading, or other types of advice or recommendations supplied or endorsed by TradingView. Read more in the Terms of Use.