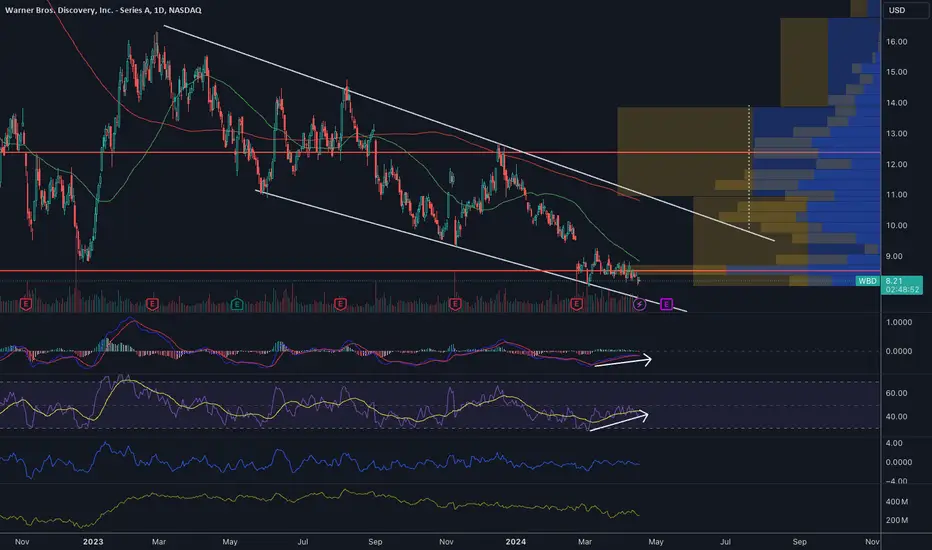
Support levels to watch if the stock goes south:
$7.40
$6.72
$5.63
While MACD and RSI are showing bullish divergences, it remains to be seen since oscillators are not showing a similar divergence. As a result, there is no clear indicator of where the stock could go at this point. ER might have to be the tie breaker.
If it manages to break out of that channel, it can run to the $12 area. But it is a big if currently.
I am not a licensed professional. None of the posts that I published are investment advice. Do your own research.
Disclaimer
The information and publications are not meant to be, and do not constitute, financial, investment, trading, or other types of advice or recommendations supplied or endorsed by TradingView. Read more in the Terms of Use.