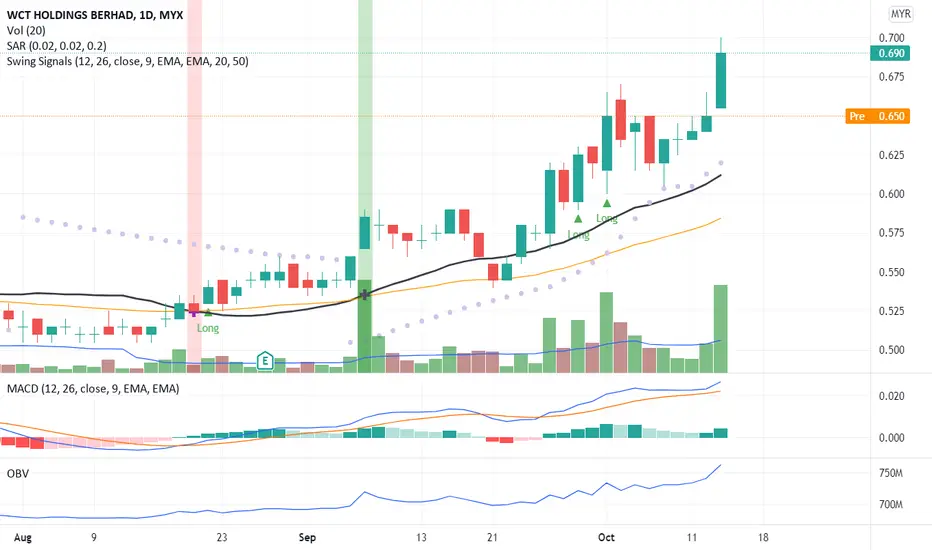
The candlestick pattern indicates a strong uptrend pattern. Hence, with a high possibility of price momentum uptrend. OBV chart also indicates a positive uptrend with cumulative total volume when the price is higher. To place a bid, use VWAP as a guideline and place your bid below VWAP line.
R 0.775
S 0.675
R 0.775
S 0.675
Disclaimer
The information and publications are not meant to be, and do not constitute, financial, investment, trading, or other types of advice or recommendations supplied or endorsed by TradingView. Read more in the Terms of Use.
Disclaimer
The information and publications are not meant to be, and do not constitute, financial, investment, trading, or other types of advice or recommendations supplied or endorsed by TradingView. Read more in the Terms of Use.