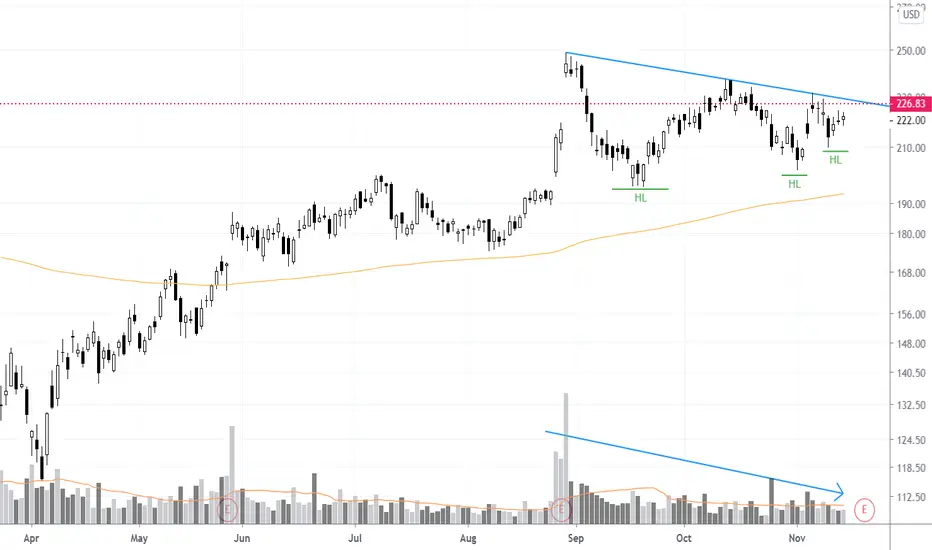
* Decreasing volume within the pattern structure
* 6 small candle stick bodies in the last 7 days indicates contraction in volatility (the calm before the next move)
* 3 higher lows (identified with green lines on the chart) indicates buyers stepping in and seeing value at higher prices
The red dotted line on the chart is the high back from July 2018. A daily close above that level will also break the down trending trend line and trigger a long trade entry.
✔ Momentum & Breakout Trader Since 2006 | Influenced by Mark Minervini VCP Trading Style & William O'Neil CANSLIM 📈
✔ Follow me on Twitter @taplot - twitter.com/TaPlot
✔ YouTube channel youtube.com/@taplot
✔ Follow me on Twitter @taplot - twitter.com/TaPlot
✔ YouTube channel youtube.com/@taplot
Disclaimer
The information and publications are not meant to be, and do not constitute, financial, investment, trading, or other types of advice or recommendations supplied or endorsed by TradingView. Read more in the Terms of Use.
