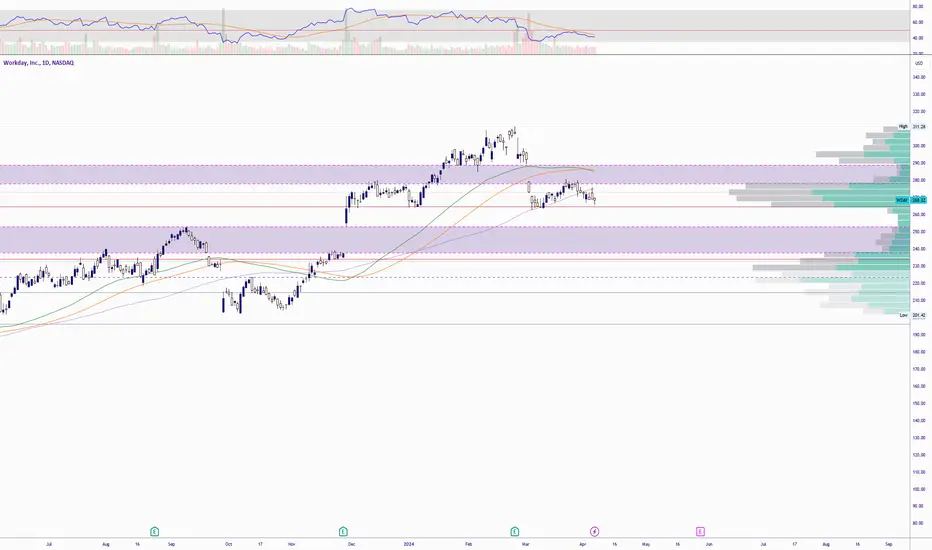
Workday with an interesting chart - obvious head and shoulders with an obvious gap below it. RSI looks meandering, but considering it's recent trend something tells me its too obvious, but we'll see.
If this breaks down, I would guess it retests the 230-240 area after the filling the gap. If it bounces, look to the 278-283 area for resistance.
If this breaks down, I would guess it retests the 230-240 area after the filling the gap. If it bounces, look to the 278-283 area for resistance.
Disclaimer
The information and publications are not meant to be, and do not constitute, financial, investment, trading, or other types of advice or recommendations supplied or endorsed by TradingView. Read more in the Terms of Use.
Disclaimer
The information and publications are not meant to be, and do not constitute, financial, investment, trading, or other types of advice or recommendations supplied or endorsed by TradingView. Read more in the Terms of Use.