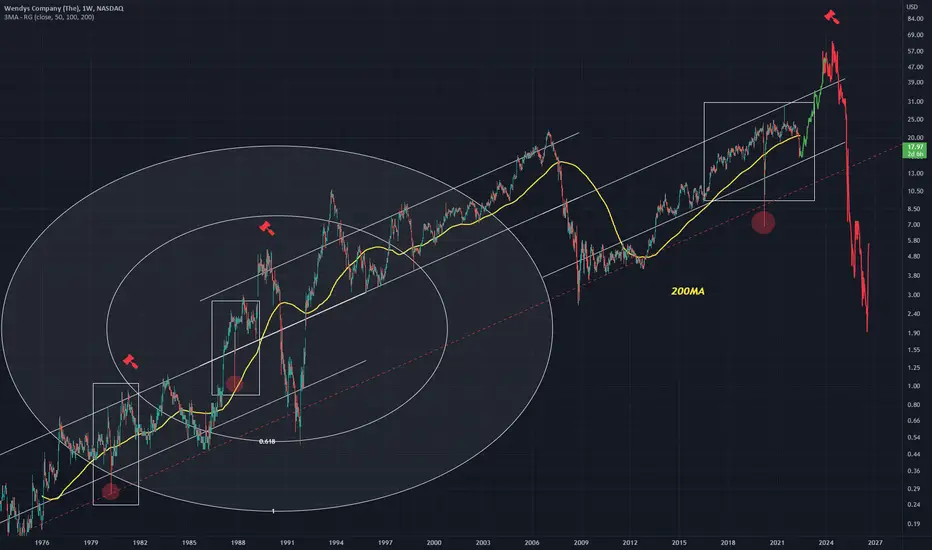
Many up channels can be drawn on chart
The lower red dotted line can be seen as a point of retesting
A common pattern can be observed in white rectangle, which shows a large wick (red circle)
I assume this pattern will repeat just on a larger scale, causing a short lived price rise, followed by a large dump, below the red line
The lower red dotted line can be seen as a point of retesting
A common pattern can be observed in white rectangle, which shows a large wick (red circle)
I assume this pattern will repeat just on a larger scale, causing a short lived price rise, followed by a large dump, below the red line
Disclaimer
The information and publications are not meant to be, and do not constitute, financial, investment, trading, or other types of advice or recommendations supplied or endorsed by TradingView. Read more in the Terms of Use.
Disclaimer
The information and publications are not meant to be, and do not constitute, financial, investment, trading, or other types of advice or recommendations supplied or endorsed by TradingView. Read more in the Terms of Use.