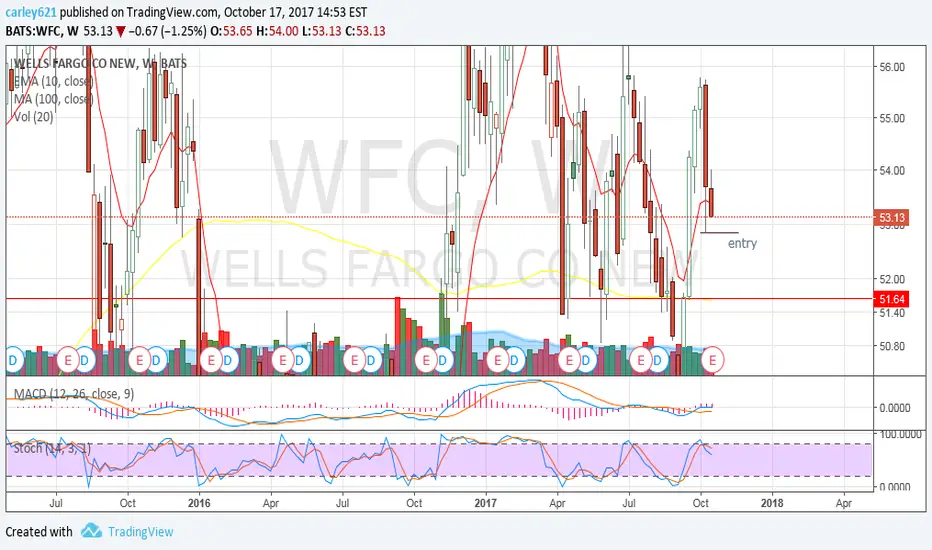
If it goes lower and breaks 52.85 it should go straight to the 100 MA on the weekly chart. I used the weekly chart because of the strong support of the 100 MA that would cause the stock to pause.
Disclaimer
The information and publications are not meant to be, and do not constitute, financial, investment, trading, or other types of advice or recommendations supplied or endorsed by TradingView. Read more in the Terms of Use.
Disclaimer
The information and publications are not meant to be, and do not constitute, financial, investment, trading, or other types of advice or recommendations supplied or endorsed by TradingView. Read more in the Terms of Use.